
Email Statistics – Summary Page
The Summary Page gives you an at-a-glance view of your email campaign’s core performance. It includes high-level engagement metrics like delivery, open, click, and bounce rates, as well as tracking unsubscribes and spam statistics.
You can also view engagement trends over time, analyze conversions, and access detailed recipient-level data such as exactly who opened, clicked, or unsubscribed from your email blast.
How to Access the Summary Page
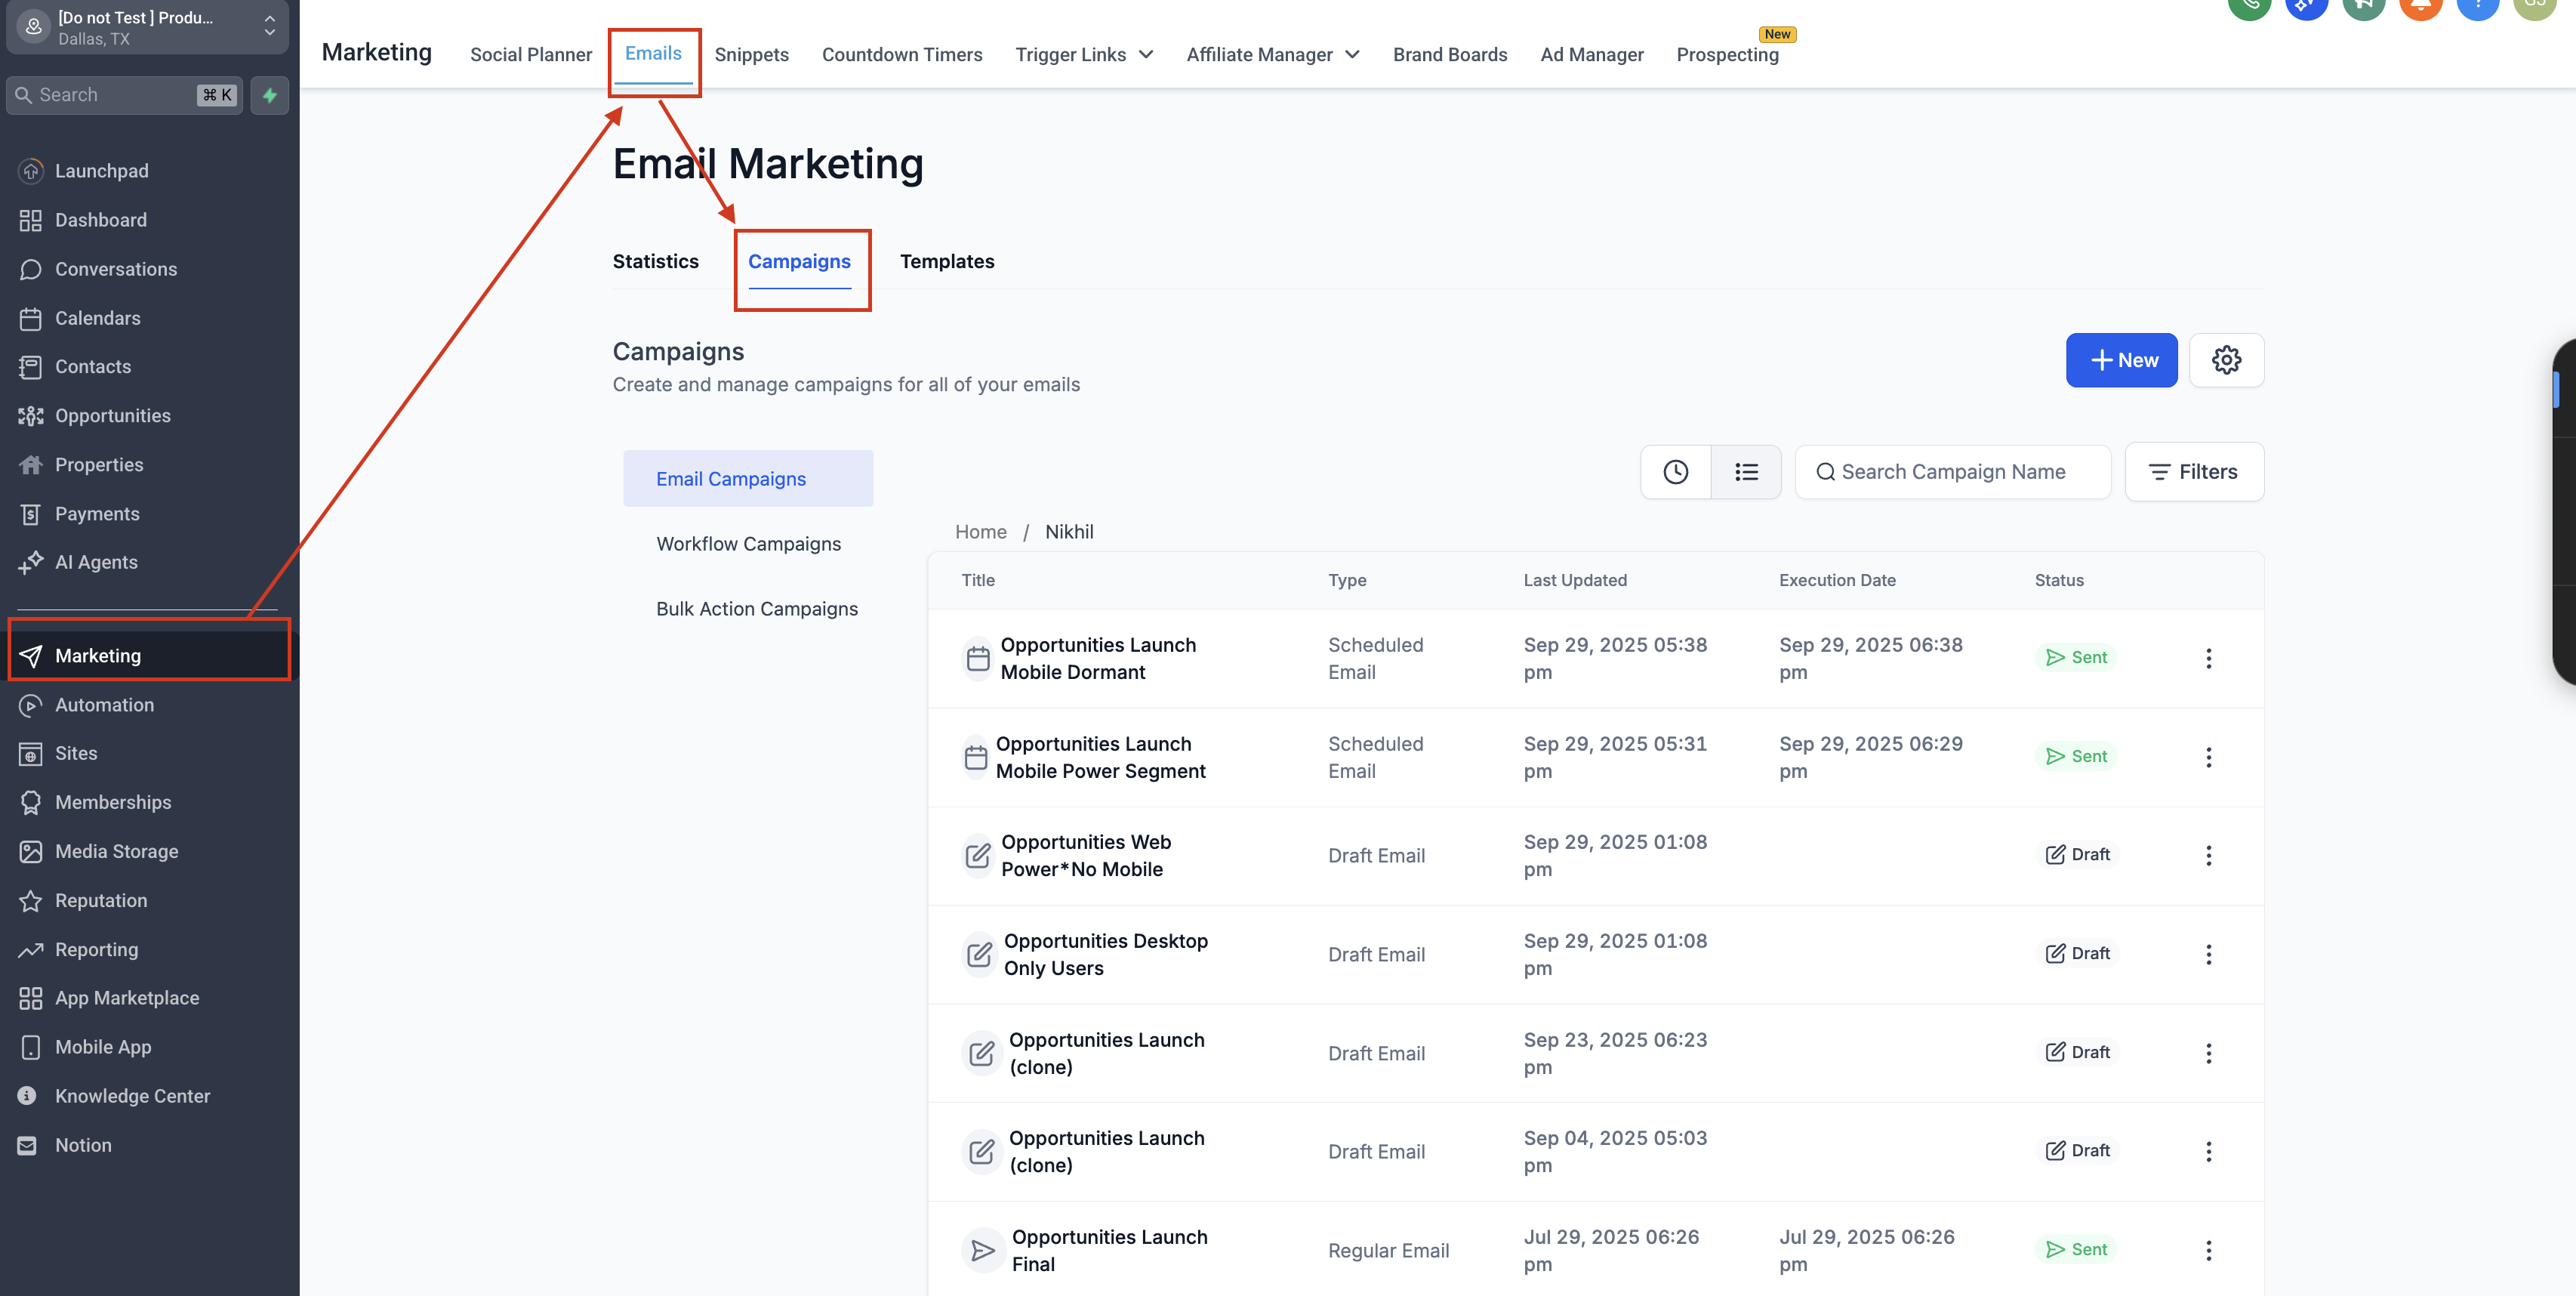
Section titled “How to Access the Summary Page”Follow these steps to locate the comprehensive summary for any sent campaign:
-
Navigate to Marketing → Emails from your main dashboard.
-
Go to the Campaigns tab.
-
Locate your already-sent email campaign in the list.
-
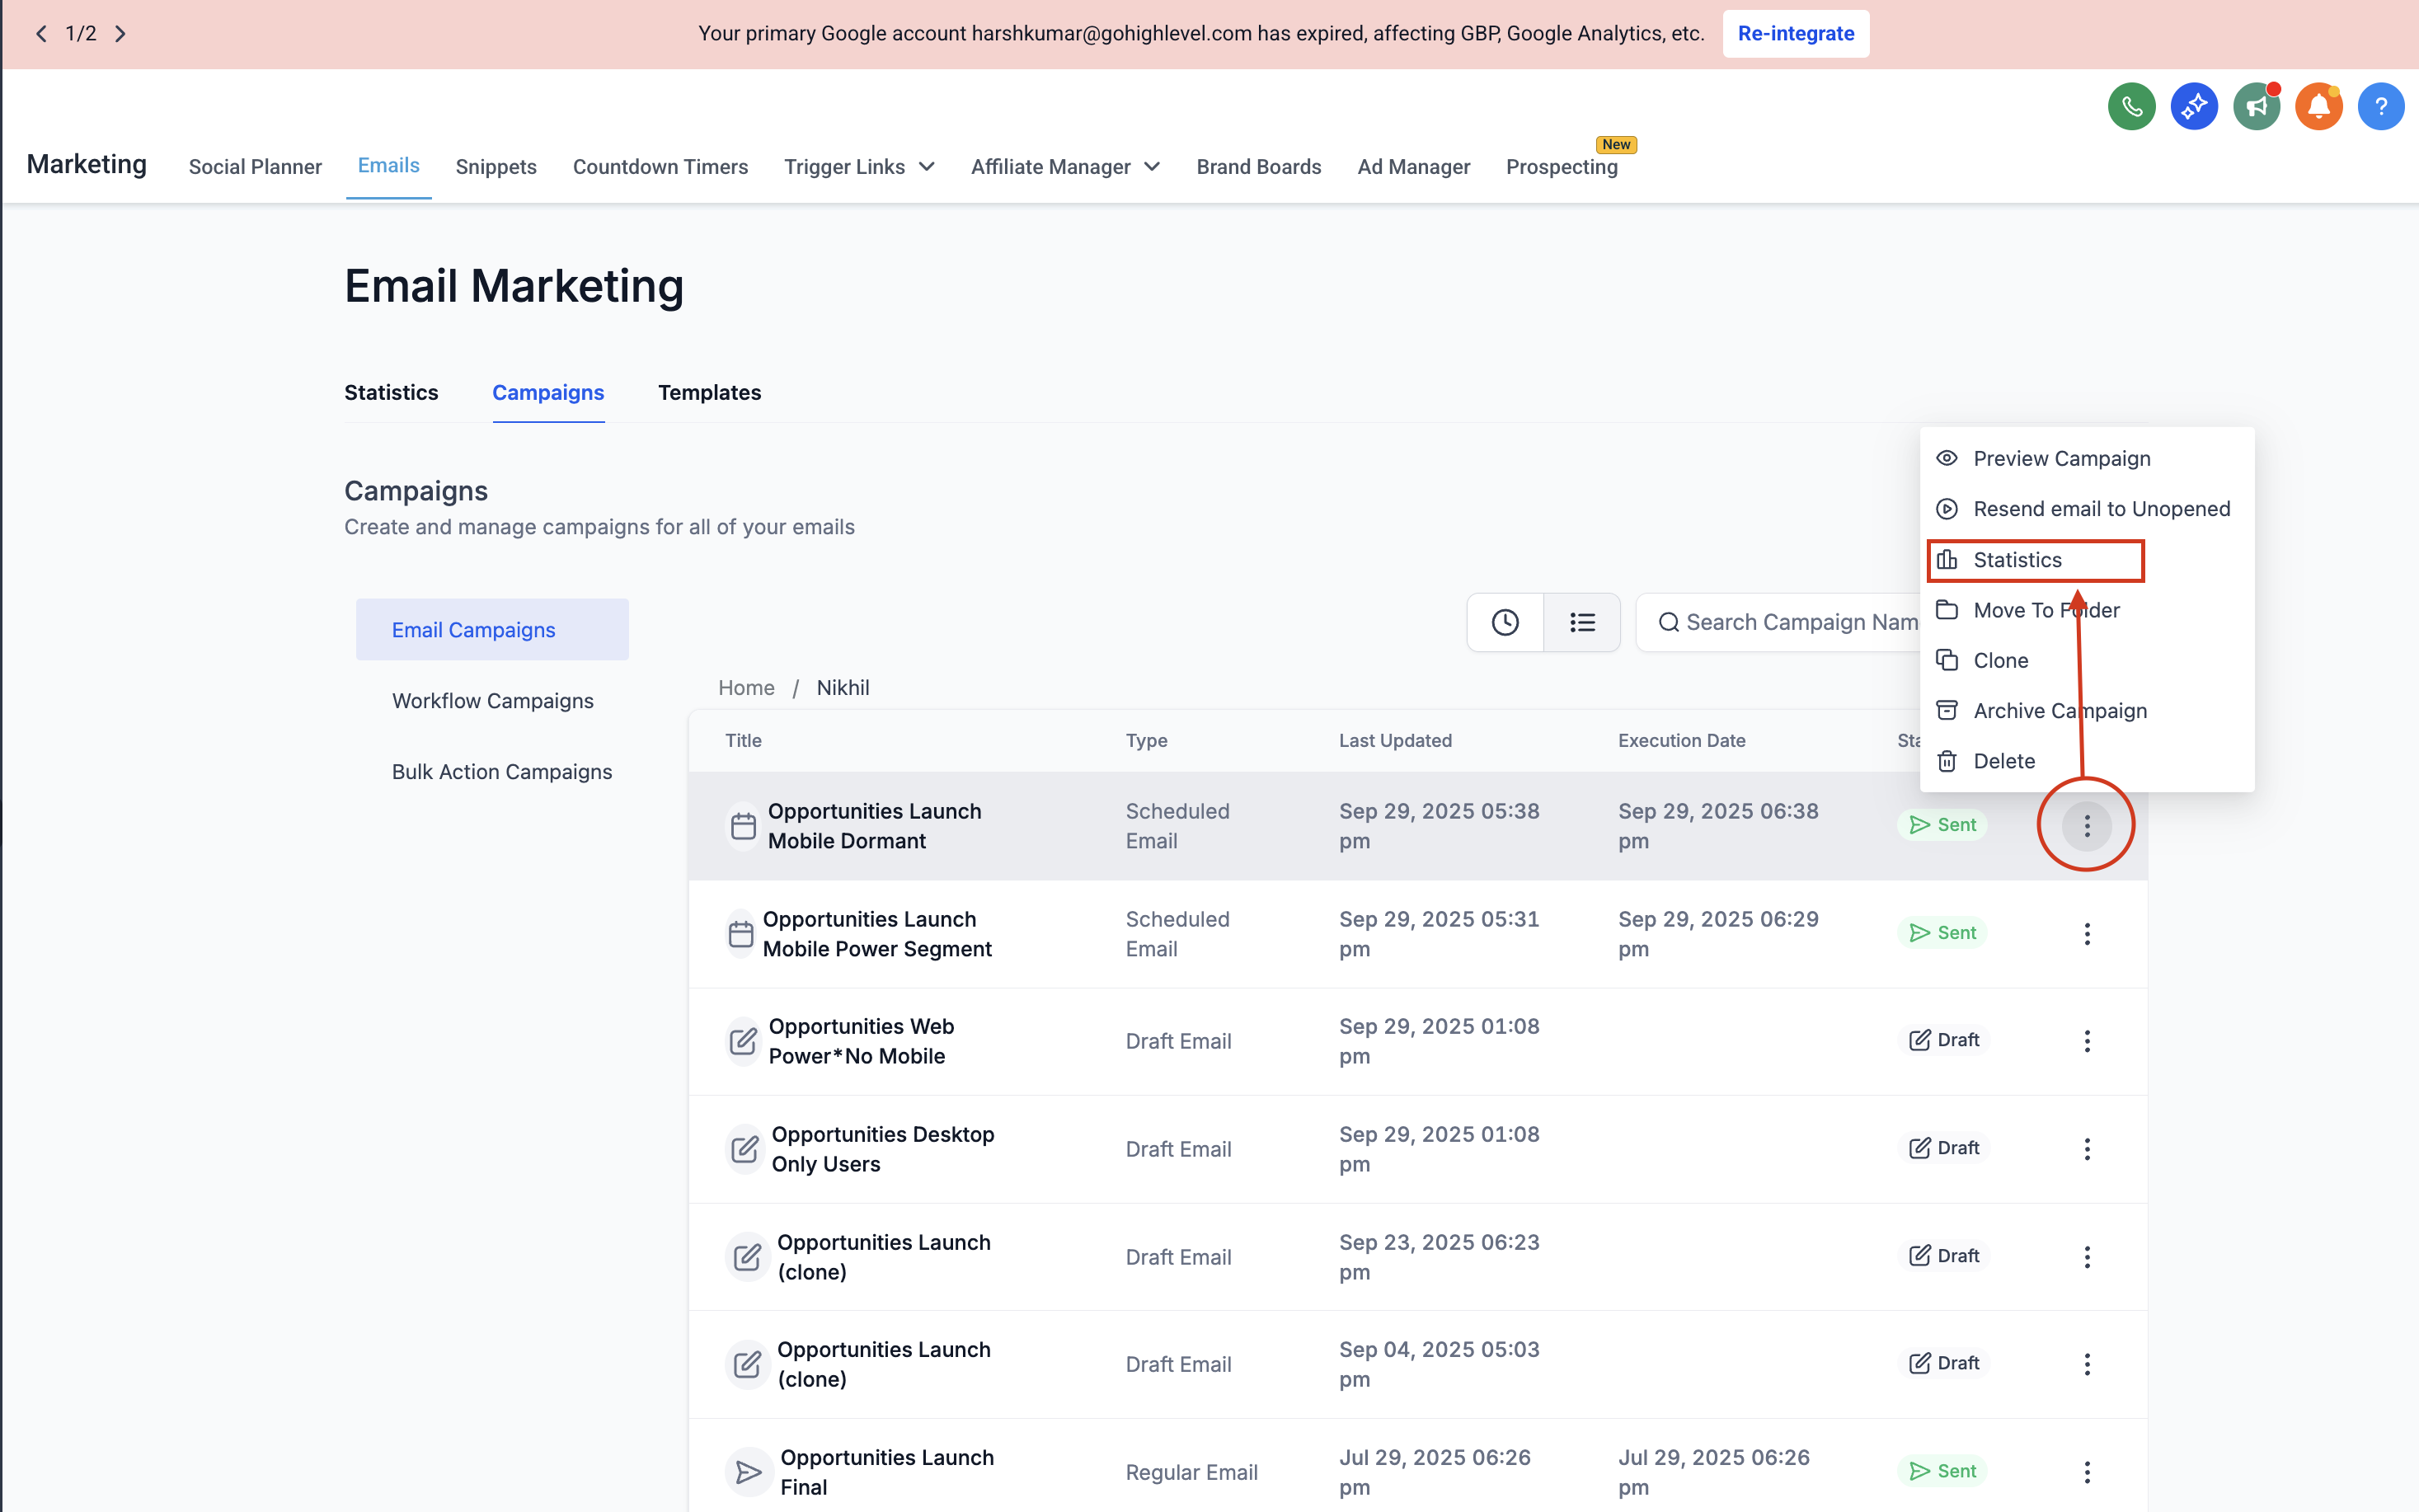
Click on the three-dot menu (⋮) next to the campaign name and select Statistics.
-
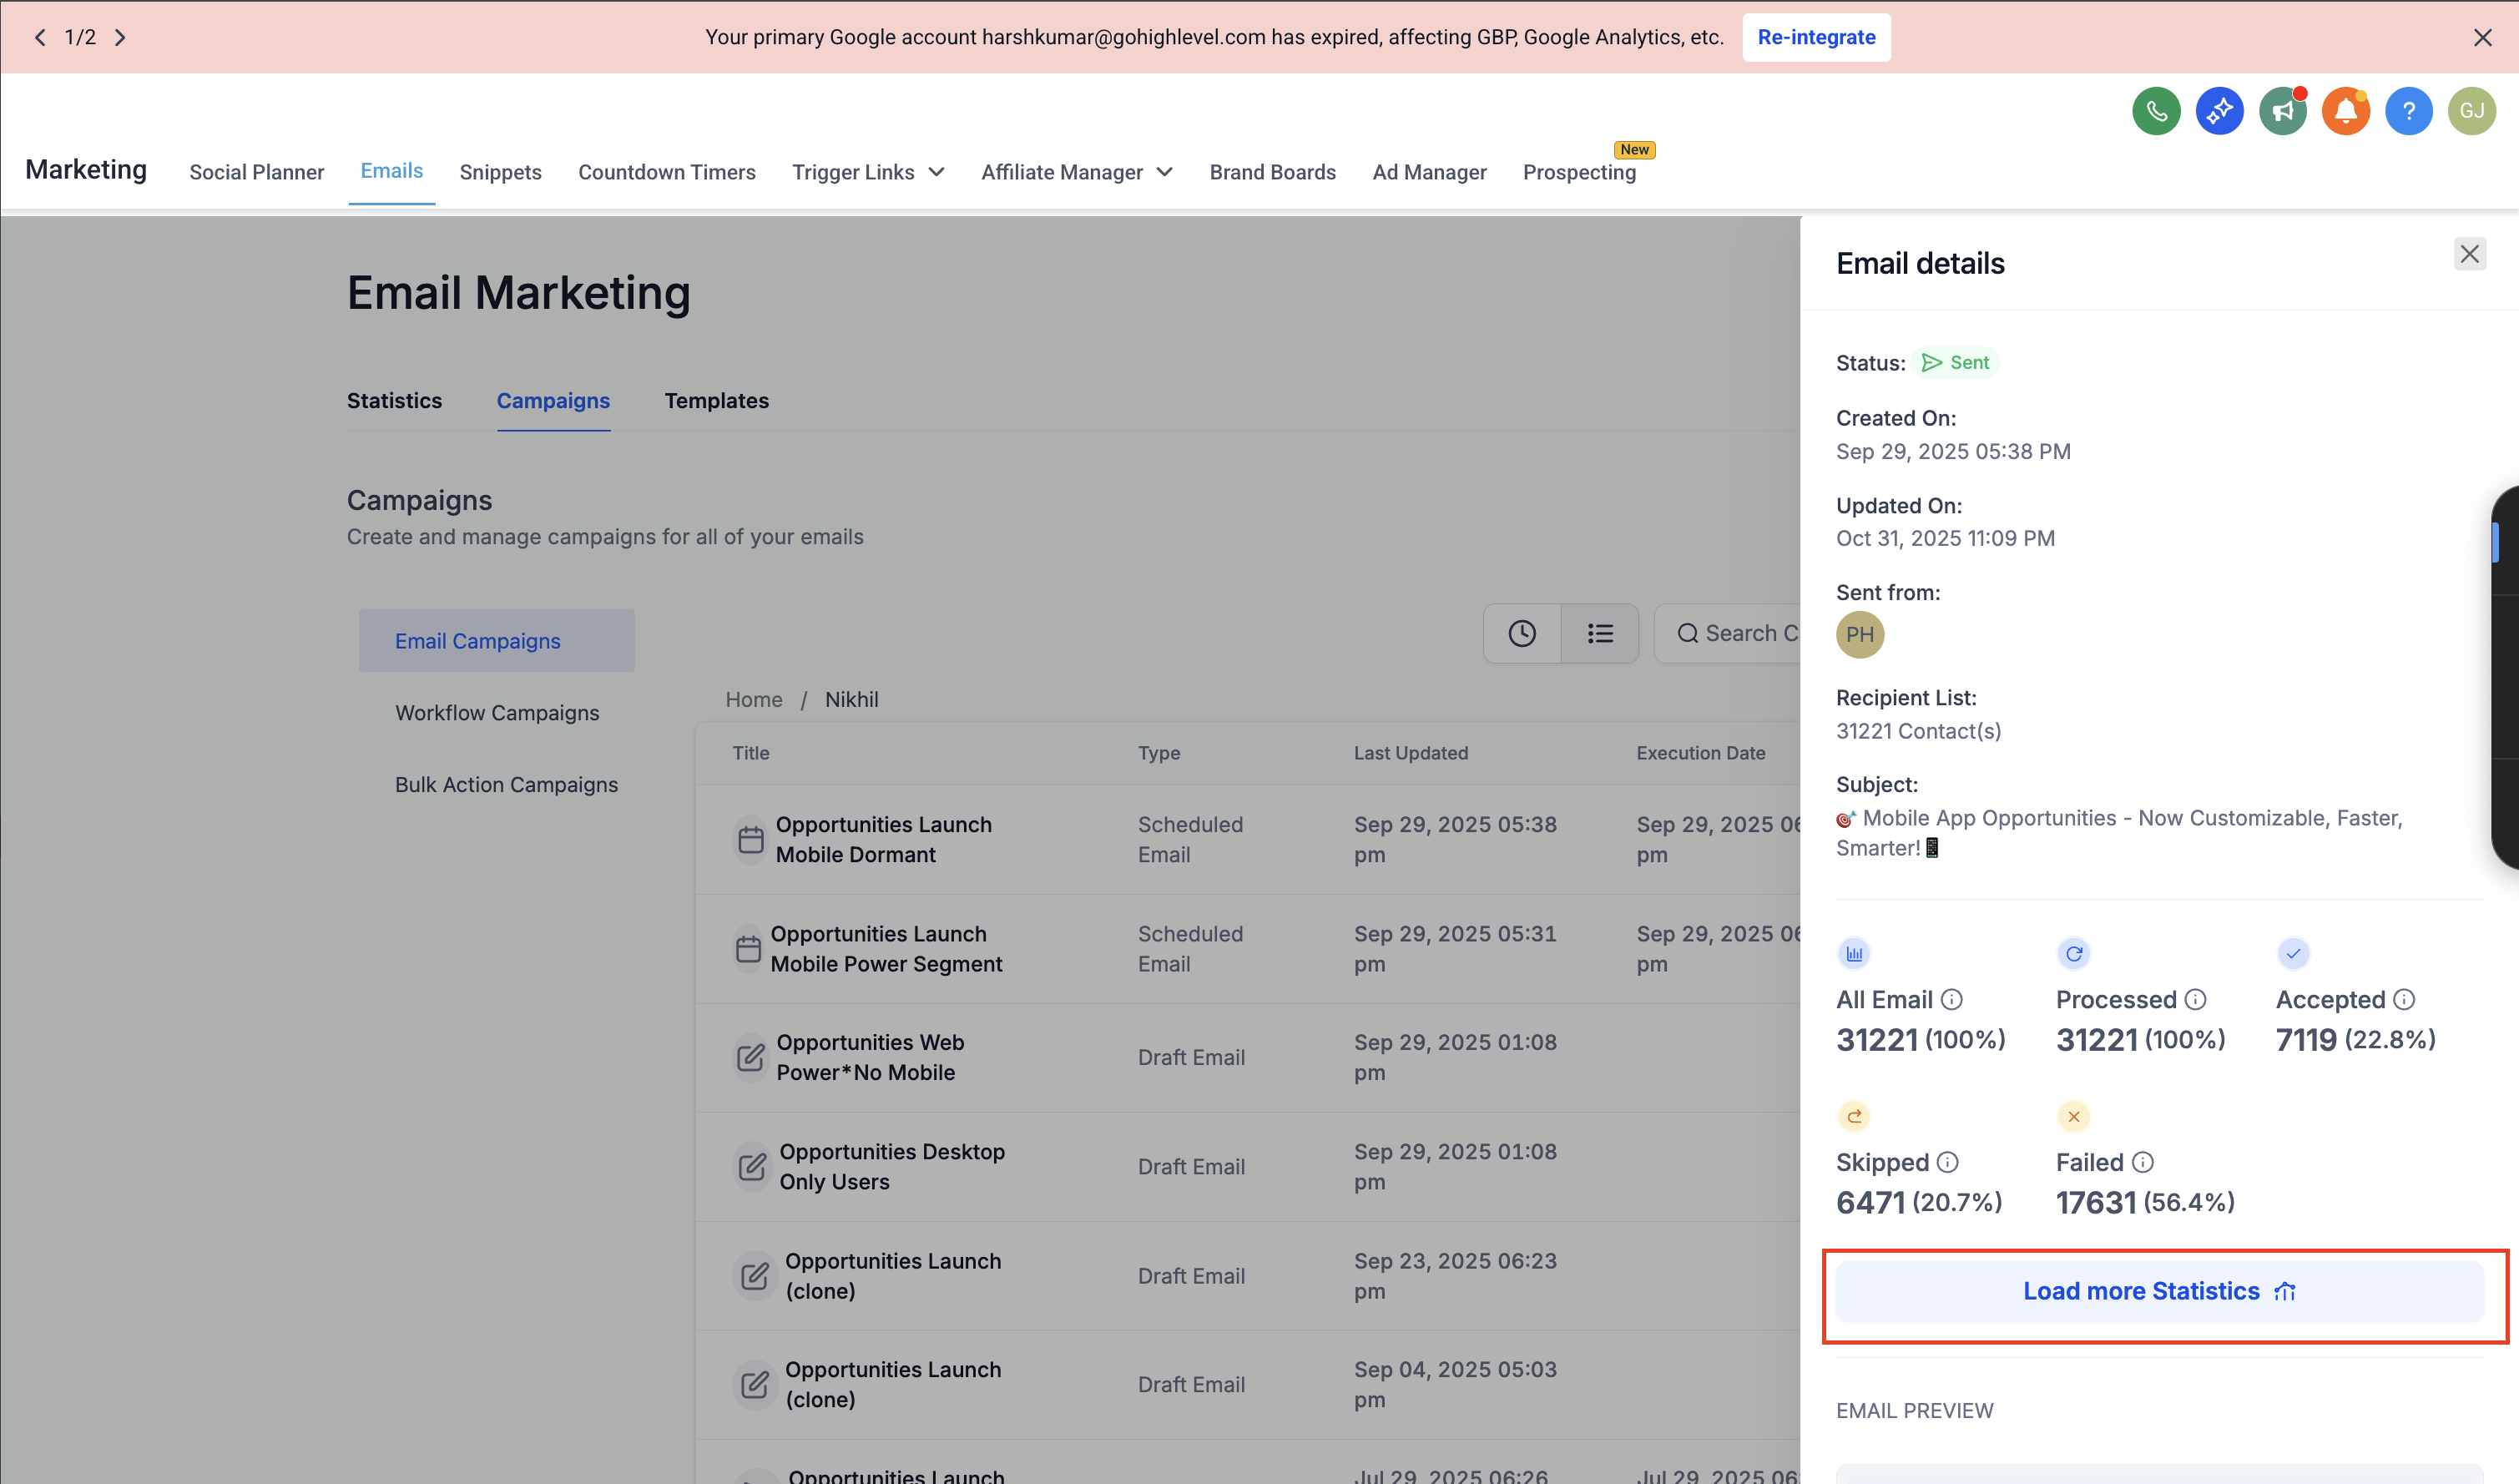
In the mini-stats side panel that opens, click Load More Statistics.
-
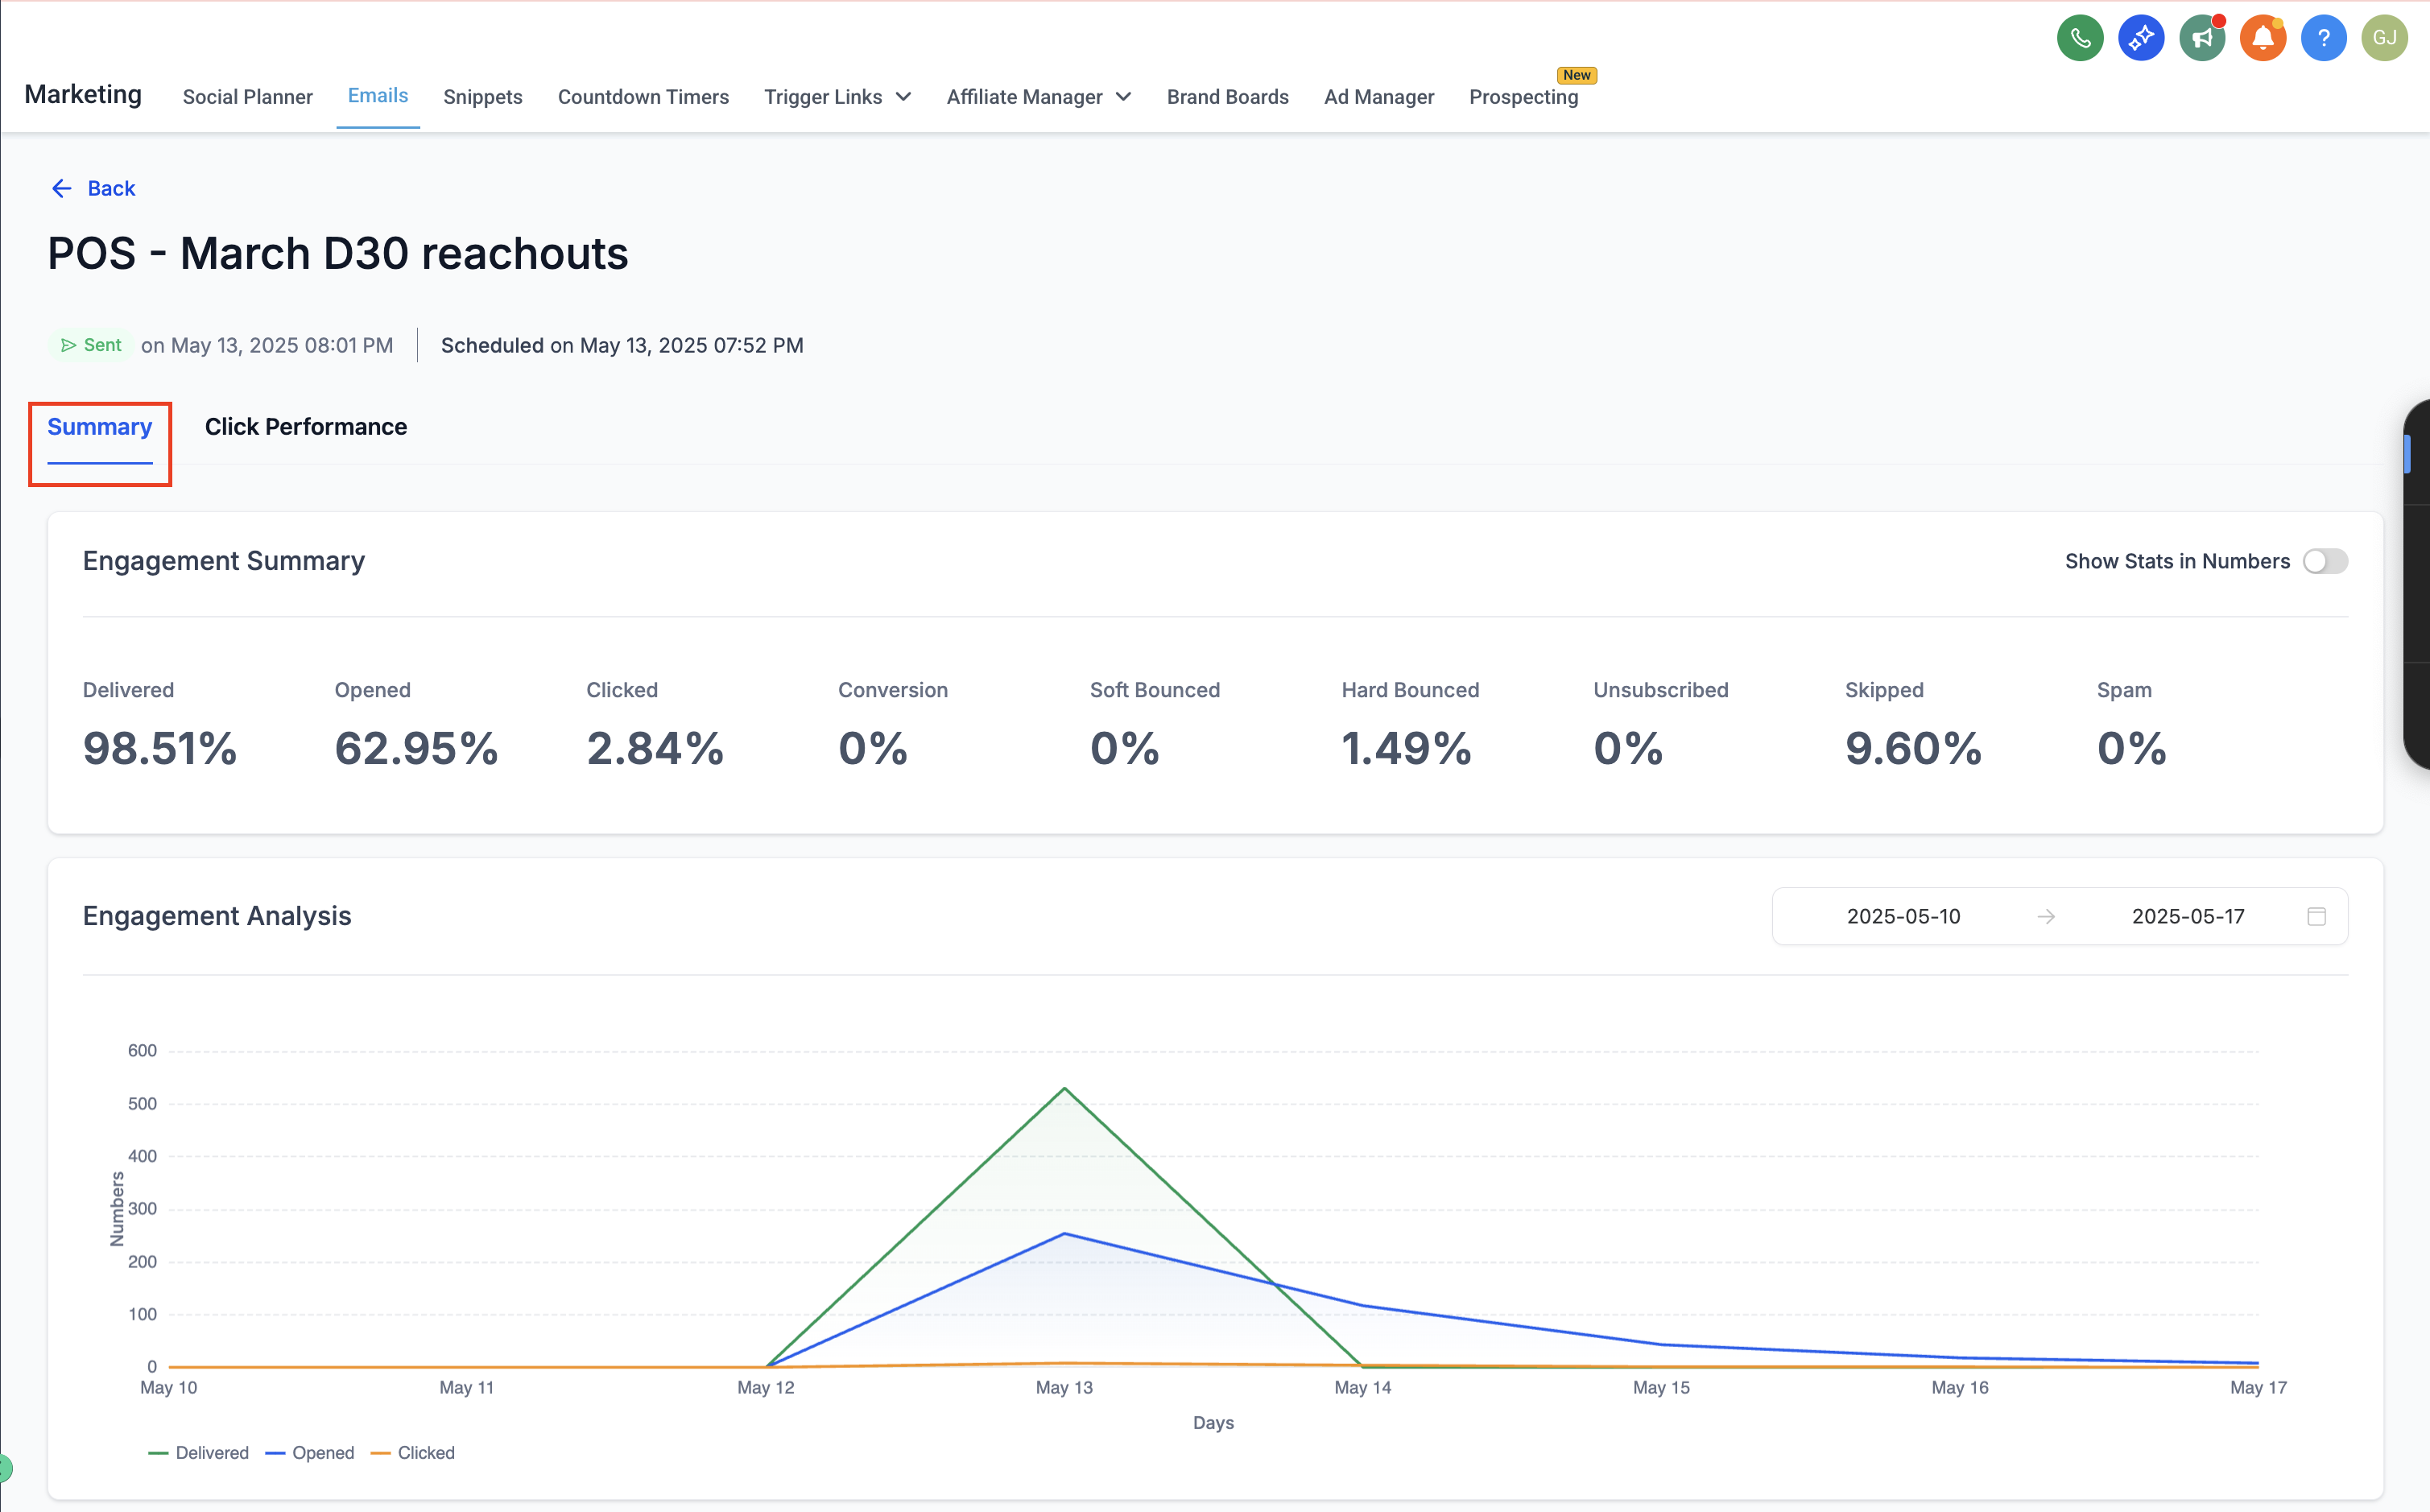
On the master statistics page, select the Summary tab at the top.
Understanding Summary Metrics
Section titled “Understanding Summary Metrics”This section breaks down the core definitions and formulas of the key numbers displayed on your dashboard.
Delivered
Section titled “Delivered”The percentage of emails that were successfully delivered to recipients’ inboxes (out of all actively sent emails).
- Formula:
(Delivered / Total Sent) × 100 - A high delivery rate (90%+) indicates a good sender reputation and clean contact lists.
Opened
Section titled “Opened”The percentage of recipients who actively opened your email at least once.
- Formula:
(Unique Opens / Delivered) × 100 - This helps measure how effective your subject line and sender name are at grabbing initial attention.
Clicked
Section titled “Clicked”The percentage of recipients who clicked at least one embedded link inside your email.
- Formula:
(Unique Clicks / Delivered) × 100 - A higher click rate explicitly shows strong engagement and effective CTA placement.
Conversion
Section titled “Conversion”The percentage of recipients who completed a desired action (like a purchase, booking, or signup) logically traced back after clicking through your email.
- Formula:
(Conversions / Delivered) × 100 - If conversions are tracked, this metric helps evaluate hard campaign ROI.
Soft Bounced vs. Hard Bounced
Section titled “Soft Bounced vs. Hard Bounced”- Soft Bounced: Emails that were temporarily undeliverable due to localized issues like a full inbox or a temporary server timeout. (Tip: These may still succeed if the server retries later).
- Hard Bounced: Emails that failed permanently (e.g., invalid addresses or blocked domains). (Tip: Regularly clean your contact list to avoid high hard bounce rates; keep this under 2%).
Unsubscribed
Section titled “Unsubscribed”The percentage of recipients who opted out using your footer’s unsubscribe link.
- Formula:
(Unsubscribed / Delivered) × 100 - A small unsubscribe rate (under 1%) is entirely normal, but higher numbers may indicate irrelevant content or excessive mailing frequency.
Skipped
Section titled “Skipped”Occurs when the email is staged and ready to send but was skipped by the server due to:
- An internal suppression issue while sending to that specific contact.
- The contact having active DND (Do Not Disturb) enabled.
The percentage of emails explicitly reported as spam by recipients to their inbox provider.
- Maintain a healthy reputation by avoiding spam-triggering keywords and ensuring strict audience relevance.
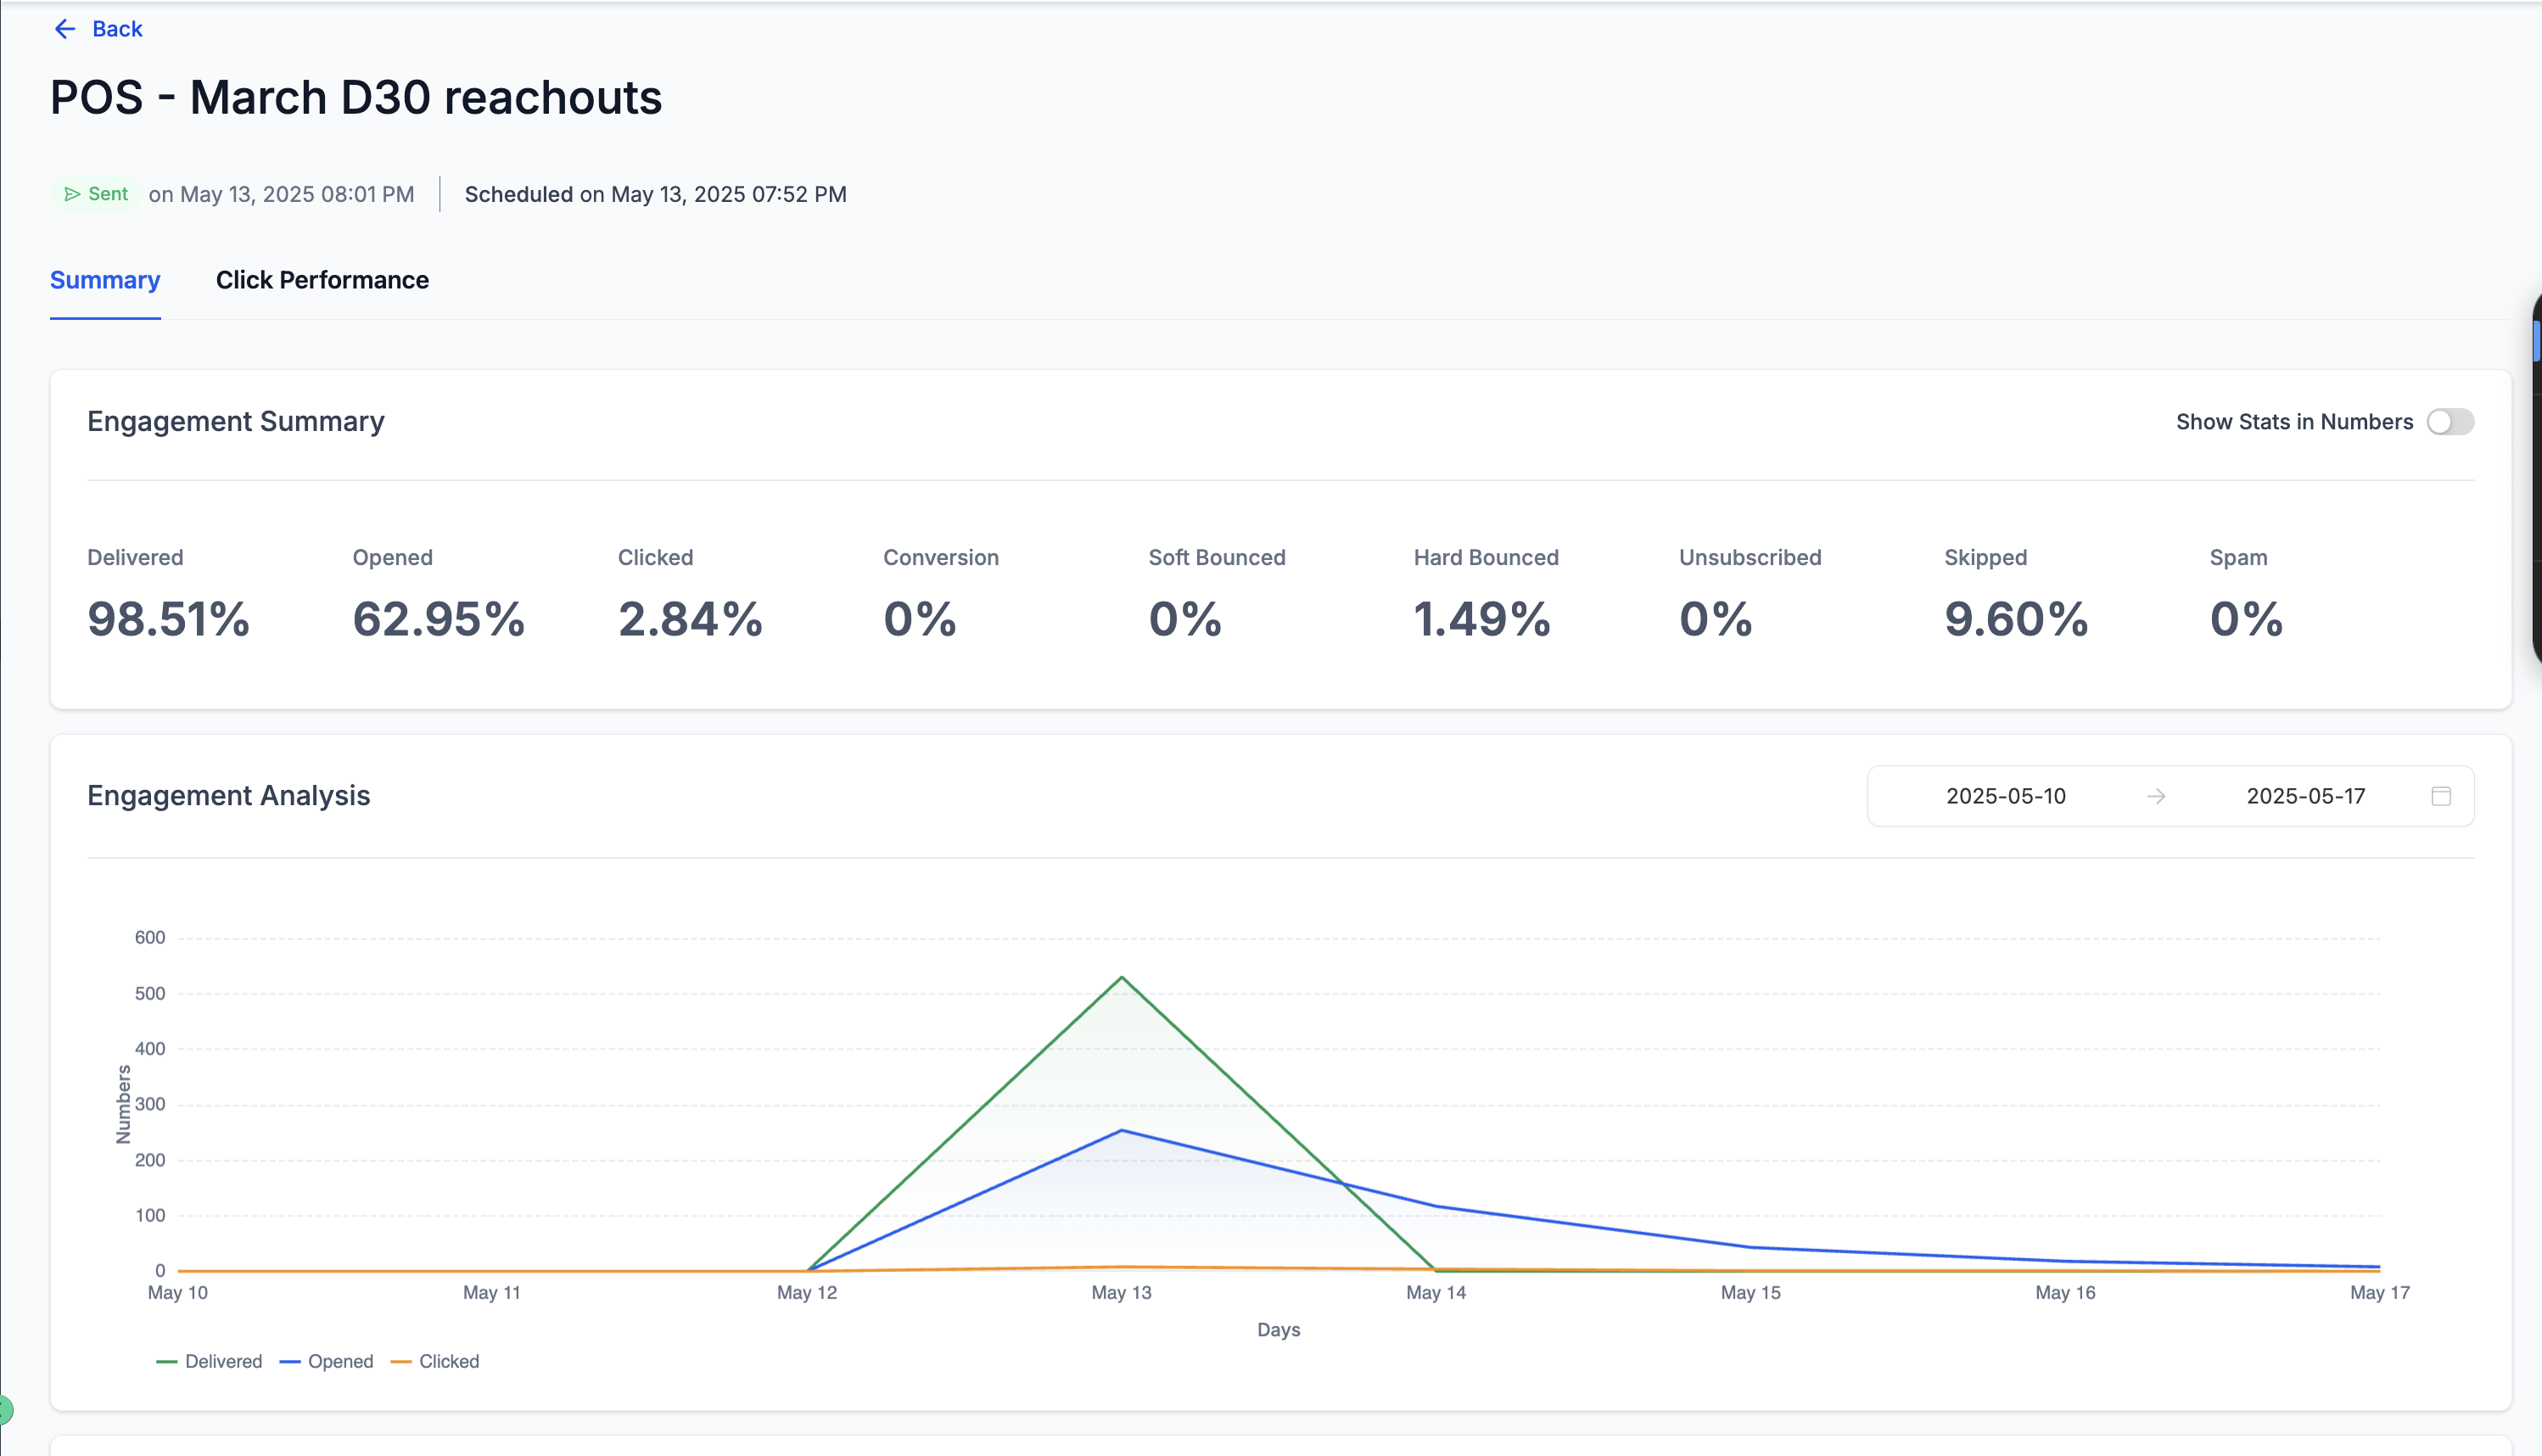
Engagement Analysis Chart
Section titled “Engagement Analysis Chart”Below the summary boxes, the Engagement Analysis graph visually displays your campaign’s key performance trends over time using three dedicated lines:
- Delivered (Green Line)
- Opened (Blue Line)
- Clicked (Orange Line)
You can view engagement activity across selected date ranges to identify precisely when most interactions occurred. (Tip: Peaks in the chart often indicate the best-performing send days or hours for your specific audience).
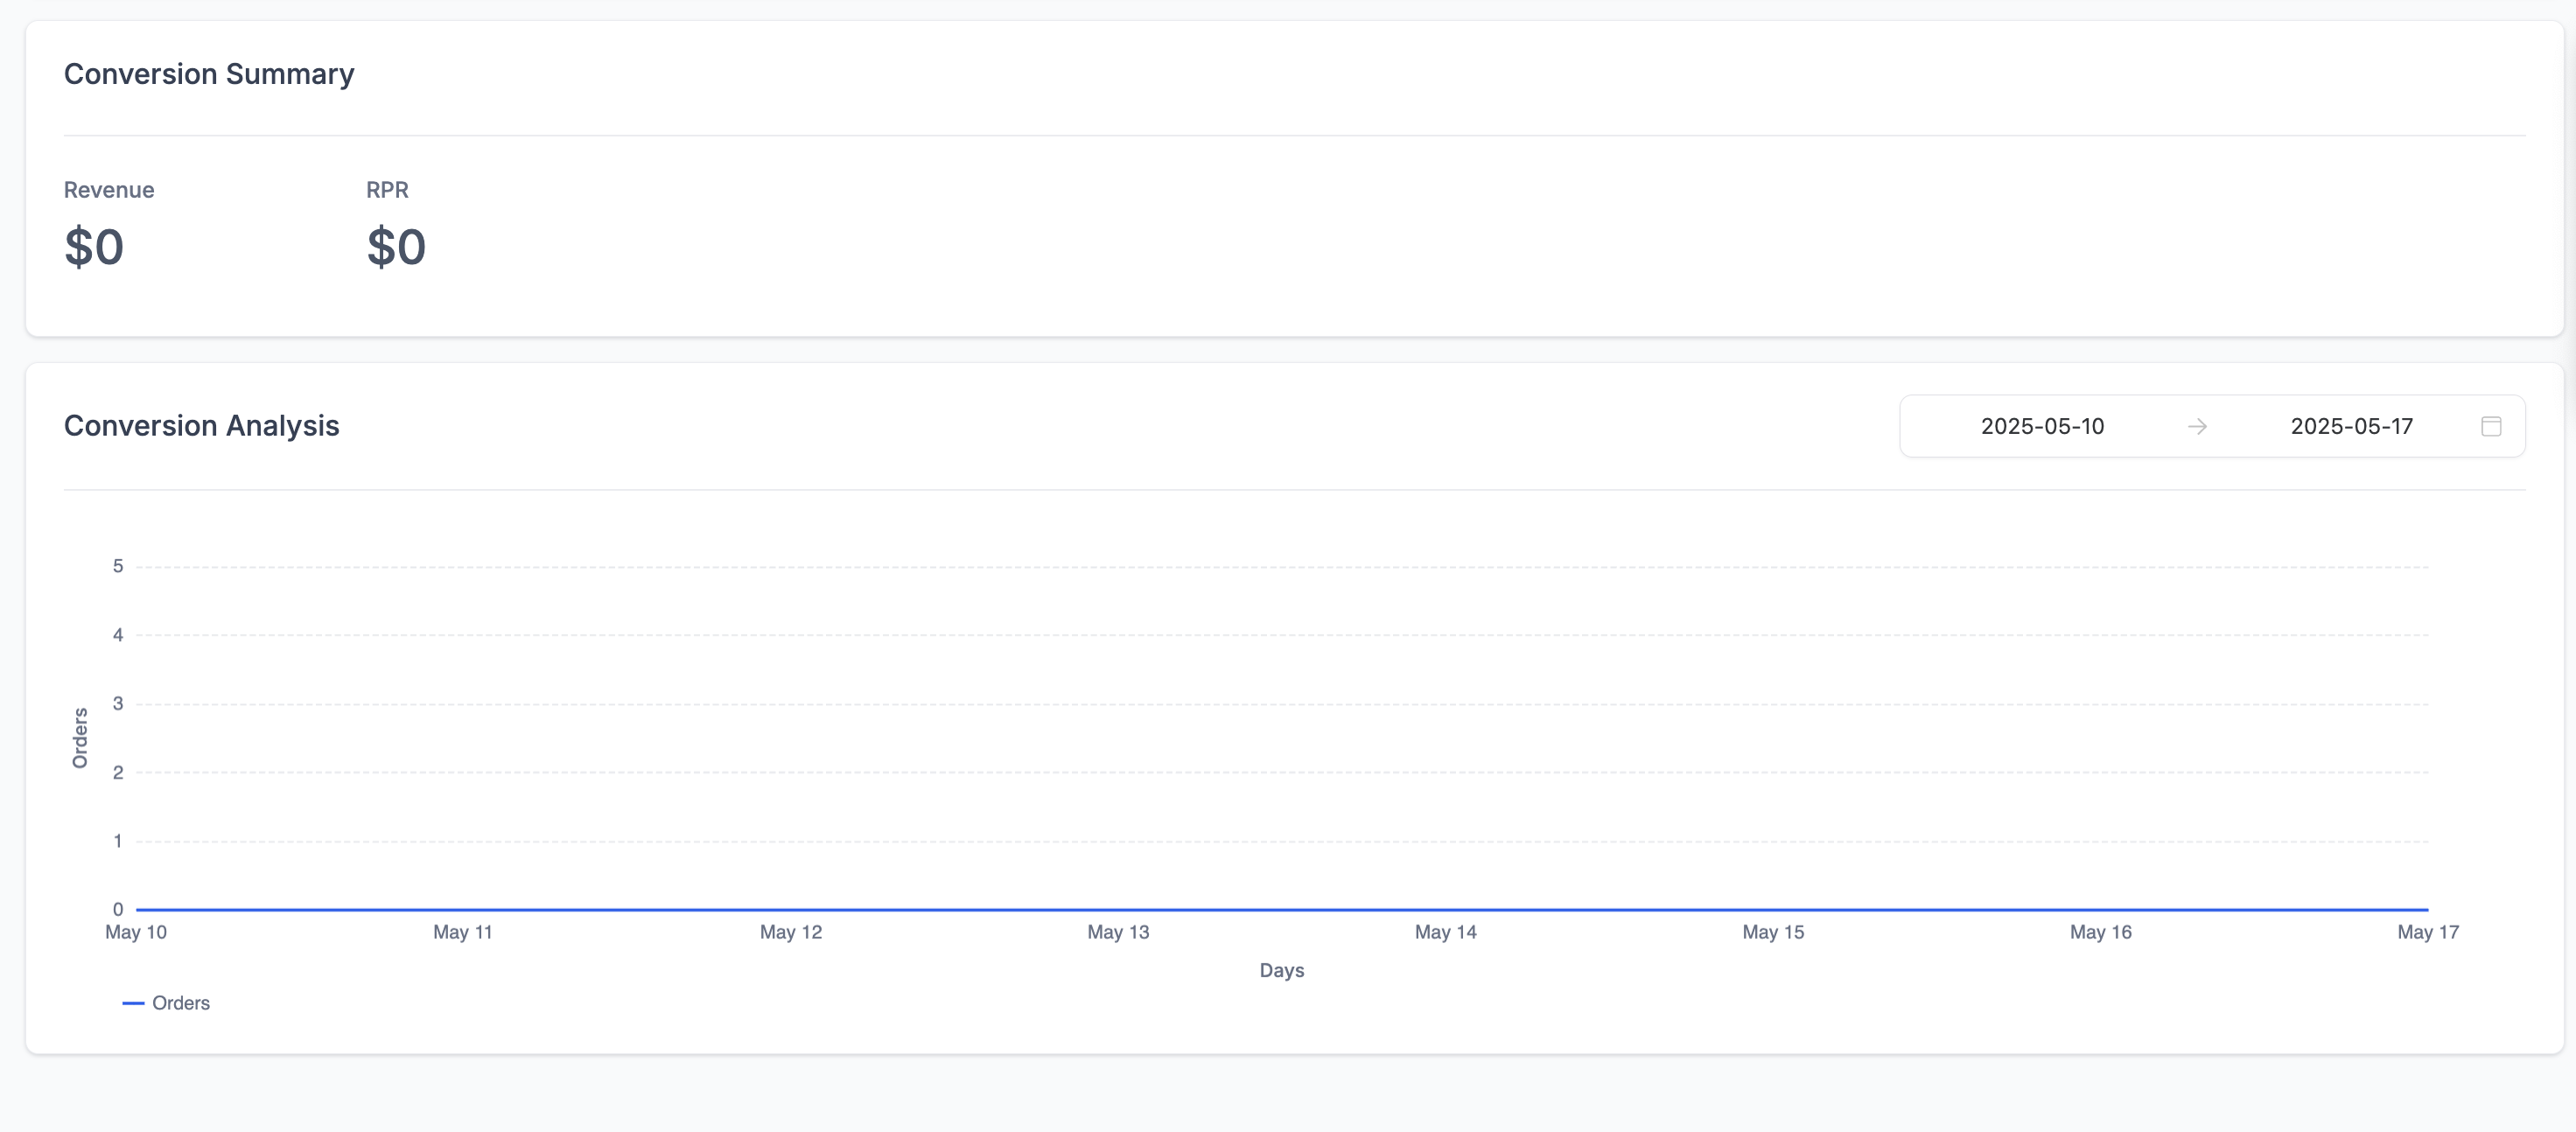
Conversion Summary and Analysis
Section titled “Conversion Summary and Analysis”If your campaign includes e-commerce integrations or active goal-tracking setups, this section displays financial returns:
- Revenue: Total gross income generated strictly from the email attribution.
- RPR (Revenue per Recipient): The average revenue earned divided per recipient.
- Conversion Analysis Chart: Tracks the pacing of orders or conversions over time.
[!NOTE] If internal revenue tracking isn’t enabled or set up for the workspace, these fields will accurately display as
$0.
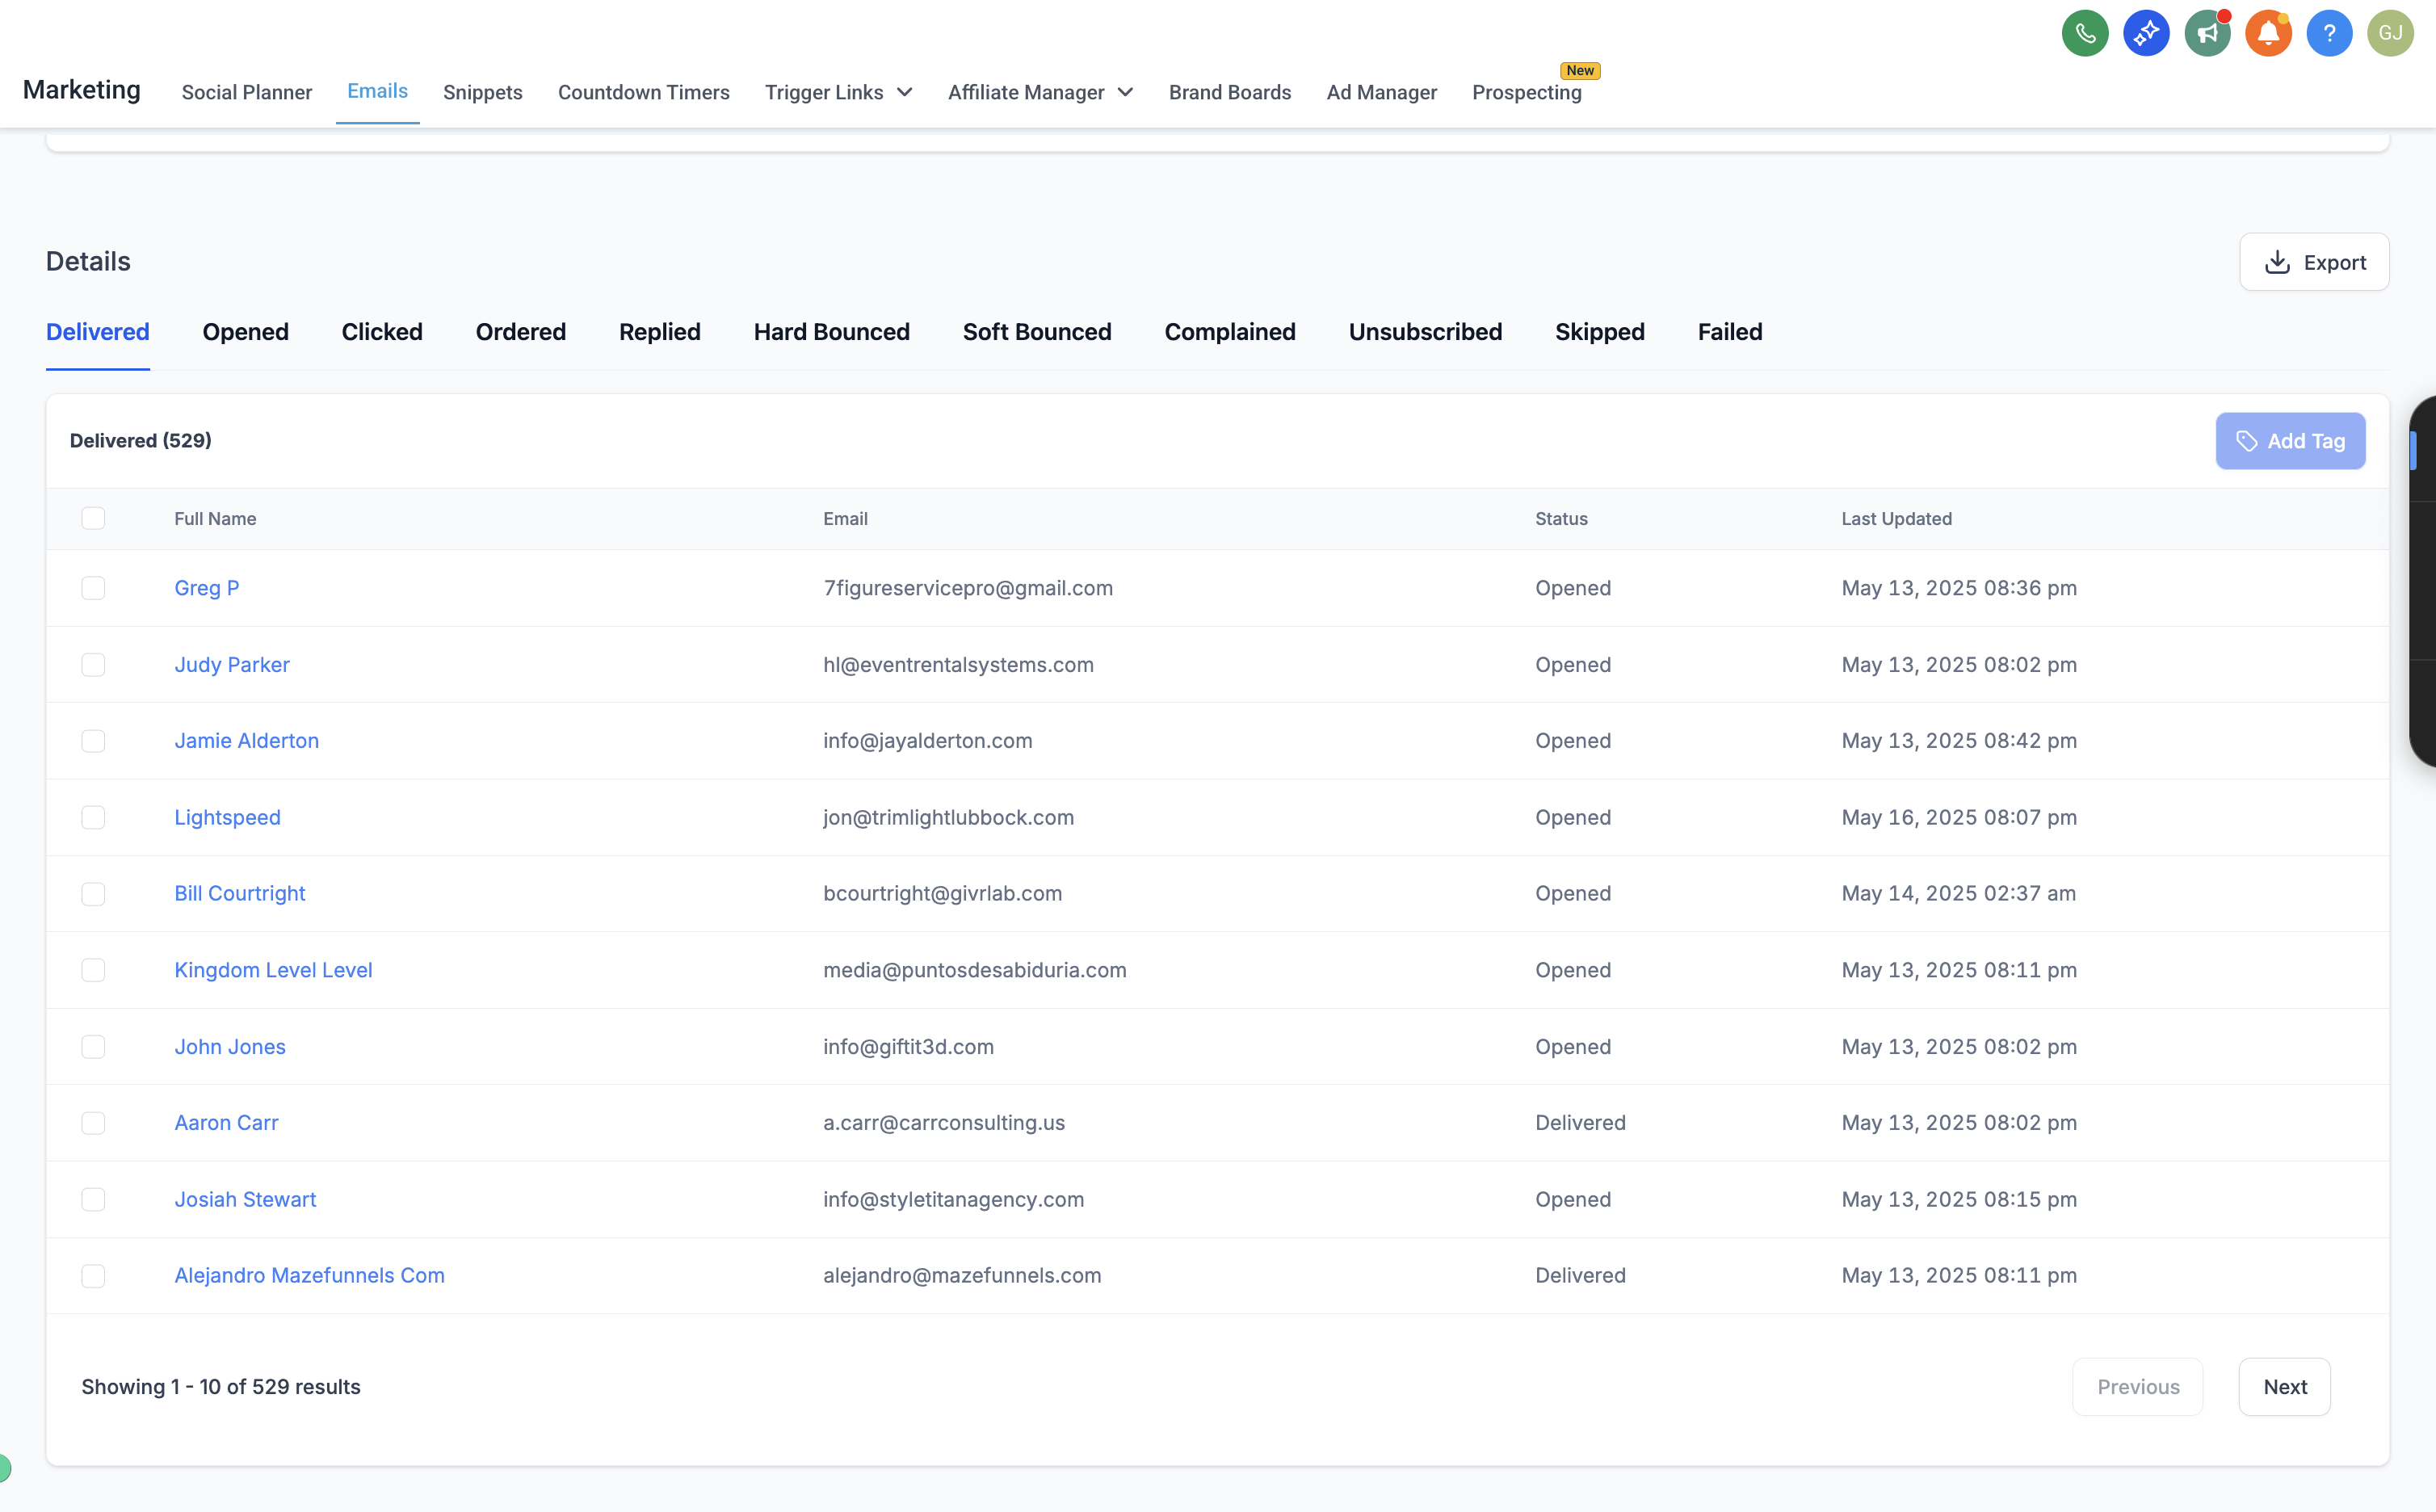
Details Tab Overview
Section titled “Details Tab Overview”The Details section lists individual contact-level engagement data, segmented by the following filter tabs:
- Delivered: All recipients who successfully received the email.
- Opened: Contacts who triggered an open event.
- Clicked: Recipients who clicked a hyperlink.
- Ordered: Contacts who made a tracked purchase.
- Replied: Recipients who responded directly backward to the designated reply-to address.
- Hard / Soft Bounced: Contacts whose emails couldn’t be dropped.
- Complained: Contacts who marked the material as spam.
- Unsubscribed: Contacts who fully opted out.
- Skipped: Contacts prevented by rules or exclusions.
- Failed: Emails that encountered terminal sending errors.
Each data column formally includes the contact’s Full Name, Email Address, Status, and Last Updated Timestamp.
You can also Export the raw data as a distinct CSV file for deeper architectural analysis or external record-keeping.
Frequently Asked Questions
Section titled “Frequently Asked Questions”Q: Why don’t I see any statistics for my campaign?
Ensure your email has actually been sent and delivered successfully. Drafts or queued scheduled campaigns won’t show active dashboard data until they’re officially dispatched.
Q: Can I download or export these reports?
Yes, you can export granular data (like Delivered, Opened, Clicked, etc.) directly from the Details section as a CSV.
Q: Can I see who specifically opened or clicked my email?
Yes. In the Details section, explicitly open the corresponding tab (such as Opened or Clicked) to view contact-level identities and engagement timestamps.