
Track Social Performance Using Advance Analytics
Advanced Analytics in the Social Planner provides a consolidated view of your social media performance across platforms, so you can easily evaluate posting volume, visibility, and engagement in one centralized place. Use these insights to identify your best-performing content, compare platforms side by side, and confidently refine your overall marketing strategy.
Currently Supported Platforms: Facebook, Instagram, LinkedIn, YouTube, Pinterest, TikTok, Google Business Profile (GBP), Threads, and Bluesky. (Note: The specific metrics available vary by platform).
Key Benefits of Advanced Analytics
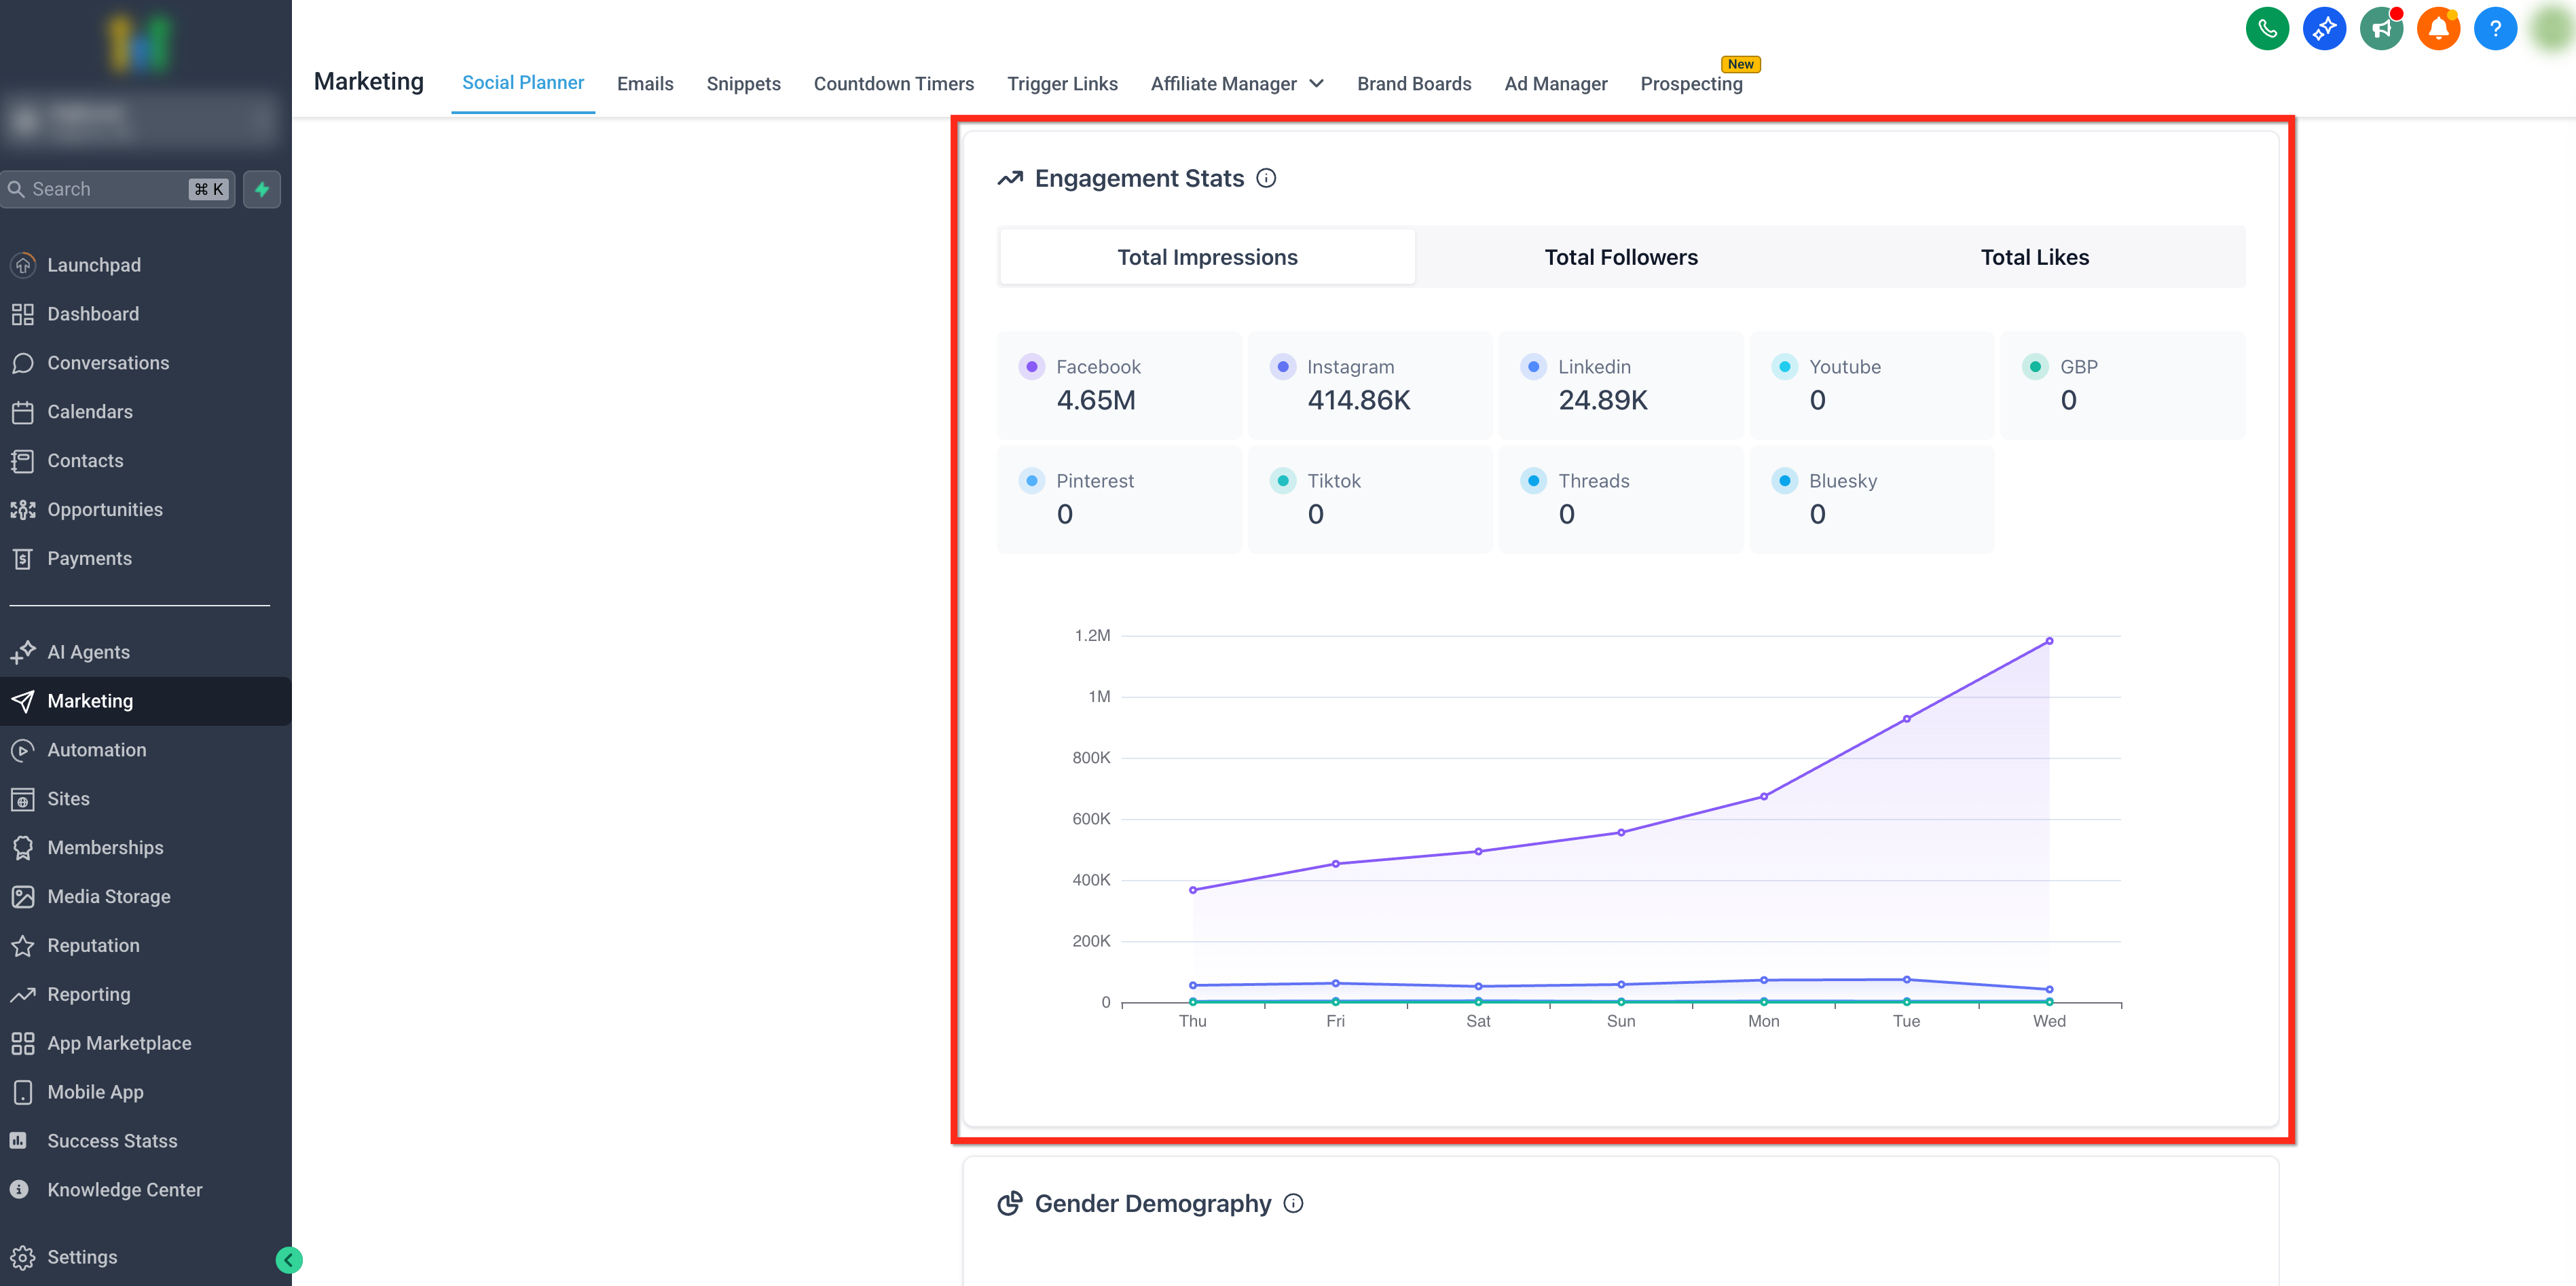
Section titled “Key Benefits of Advanced Analytics”- Comprehensive Social Media Insights: Track the number of posts, likes, comments, followers, impressions, and reach across many social media platforms from a single dashboard.
- Visualize Your Performance: Interactive graphs showcase post trends and weekly performance trajectories.
- Engagement Breakdown: Get a detailed view of engagement metrics such as total likes, comments, and shares, categorized per platform.
- Platform Comparisons: Identify which network drives the most engagement, helping you tailor your content strategy effectively.
- Impressions and Post Reach: Measure your content’s exact visibility.
- Gender and Age Demographics: See your audience breakdown in terms of age groups and gender to optimize your messaging for the right demographic.
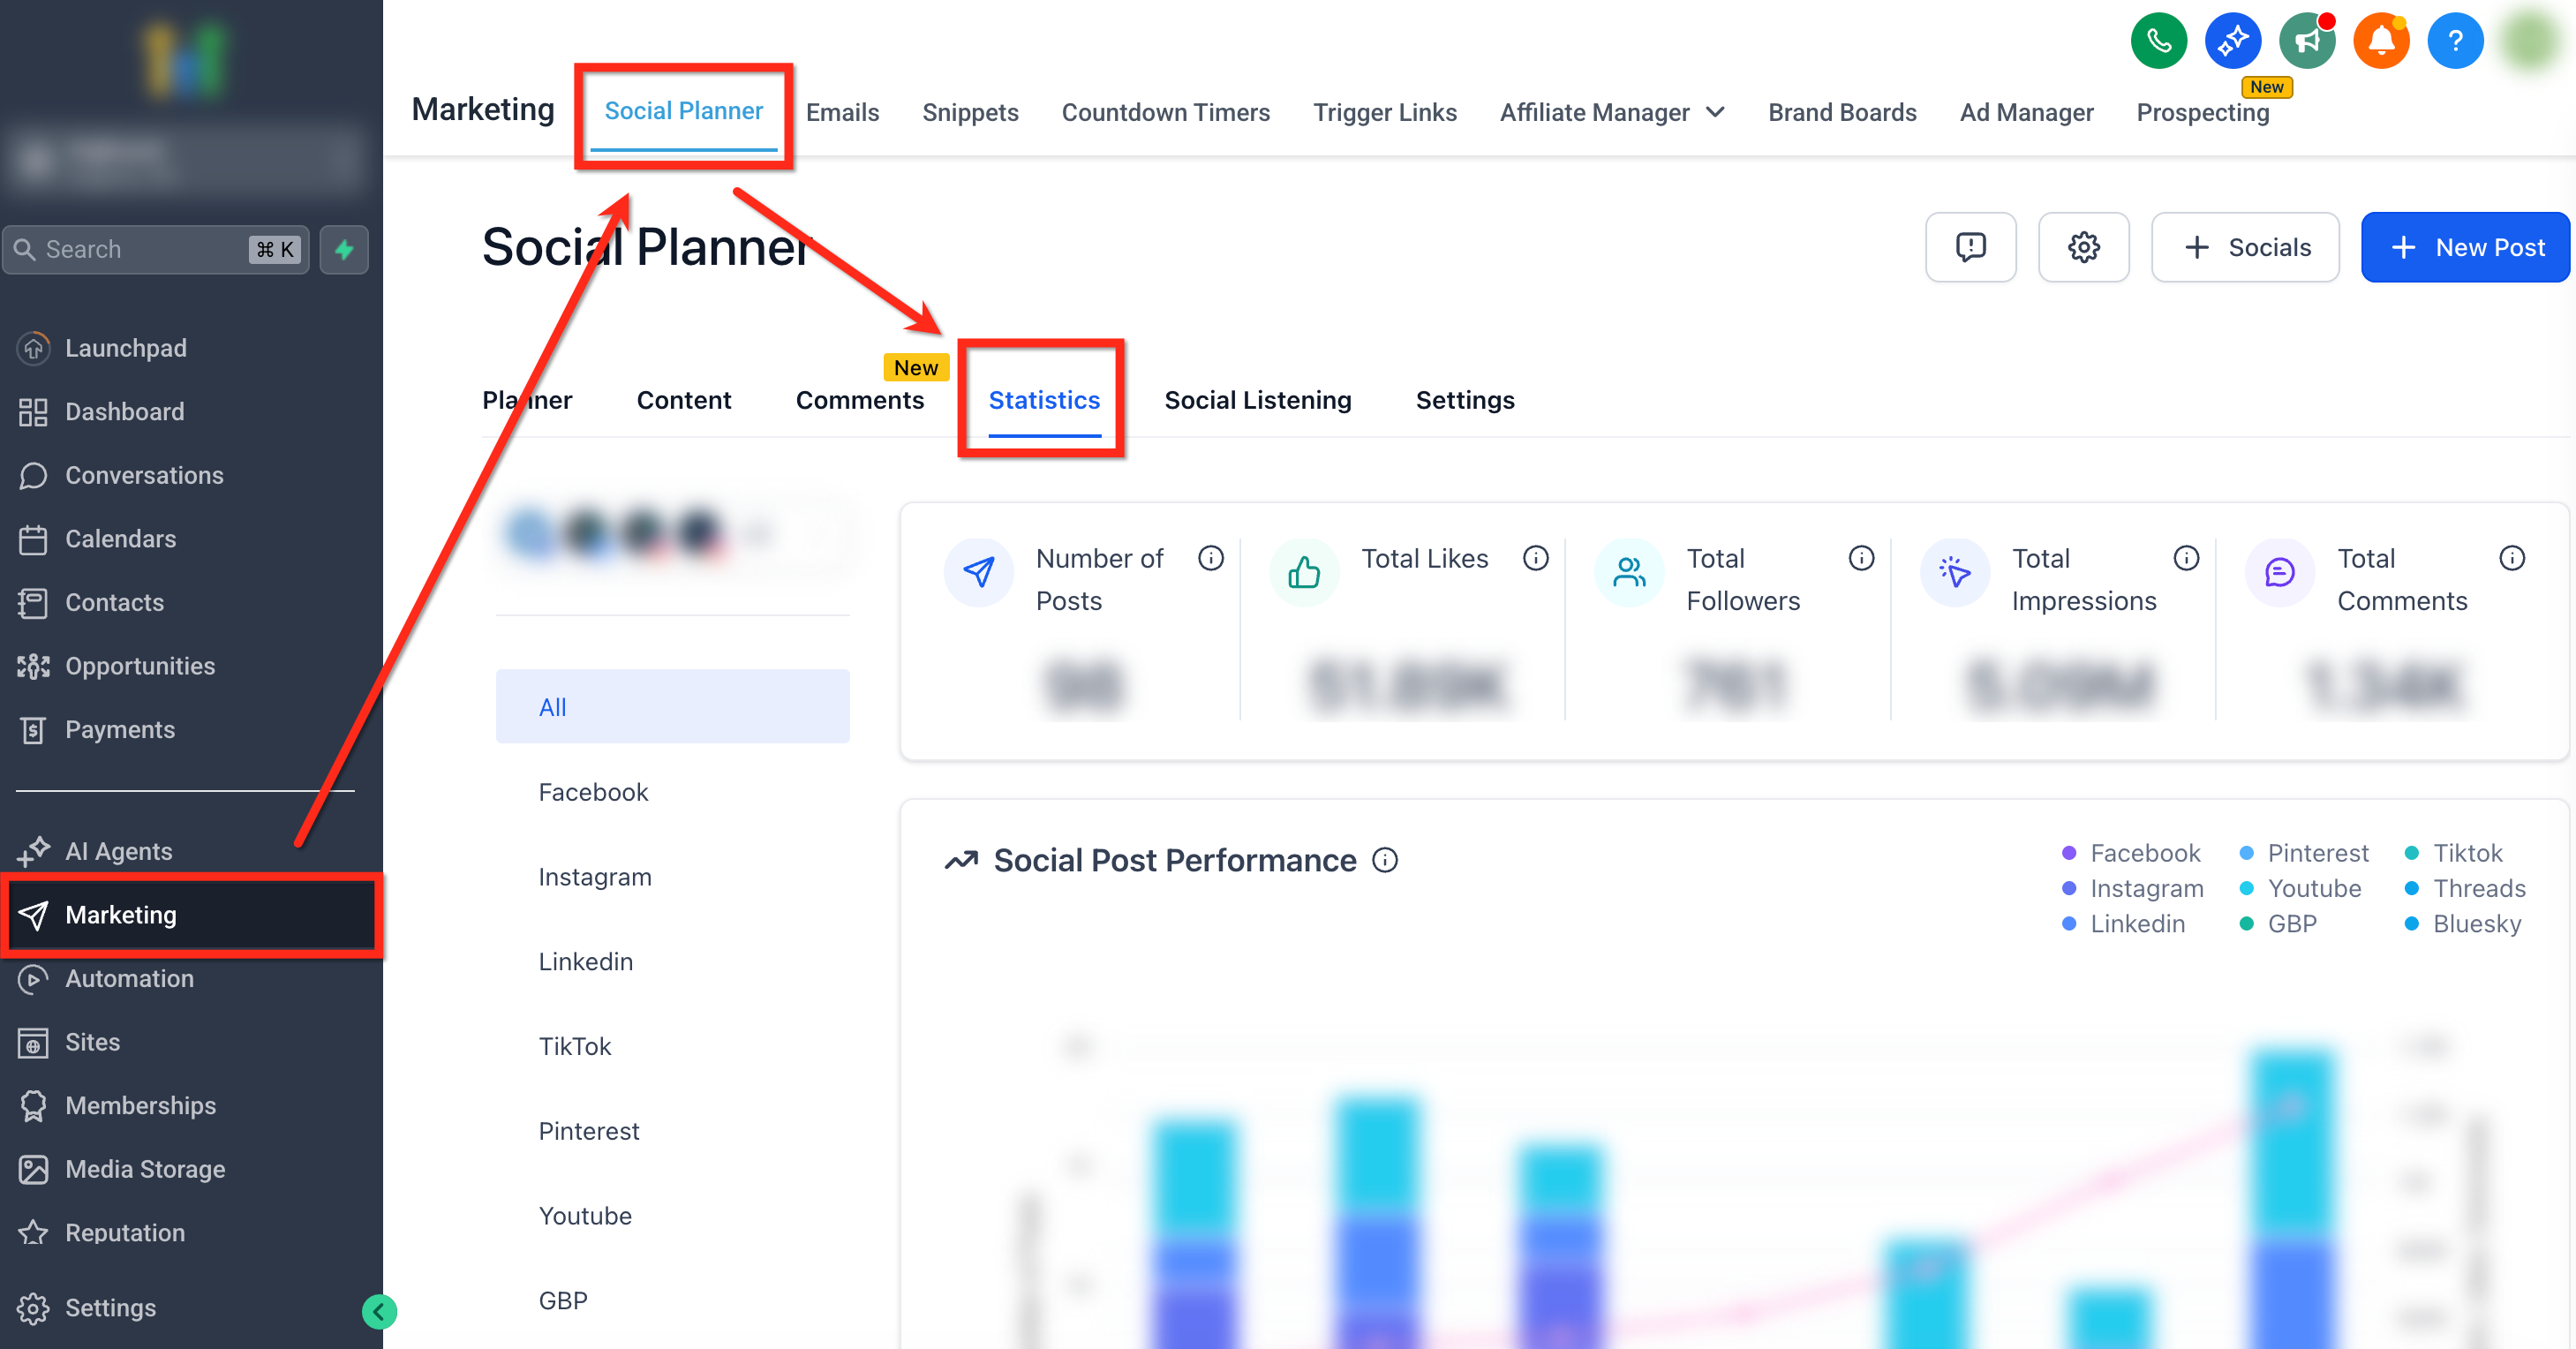
Where to Find Advanced Analytics
Section titled “Where to Find Advanced Analytics”To access the analytics dashboard, navigate to Marketing > Social Planner > Statistics.
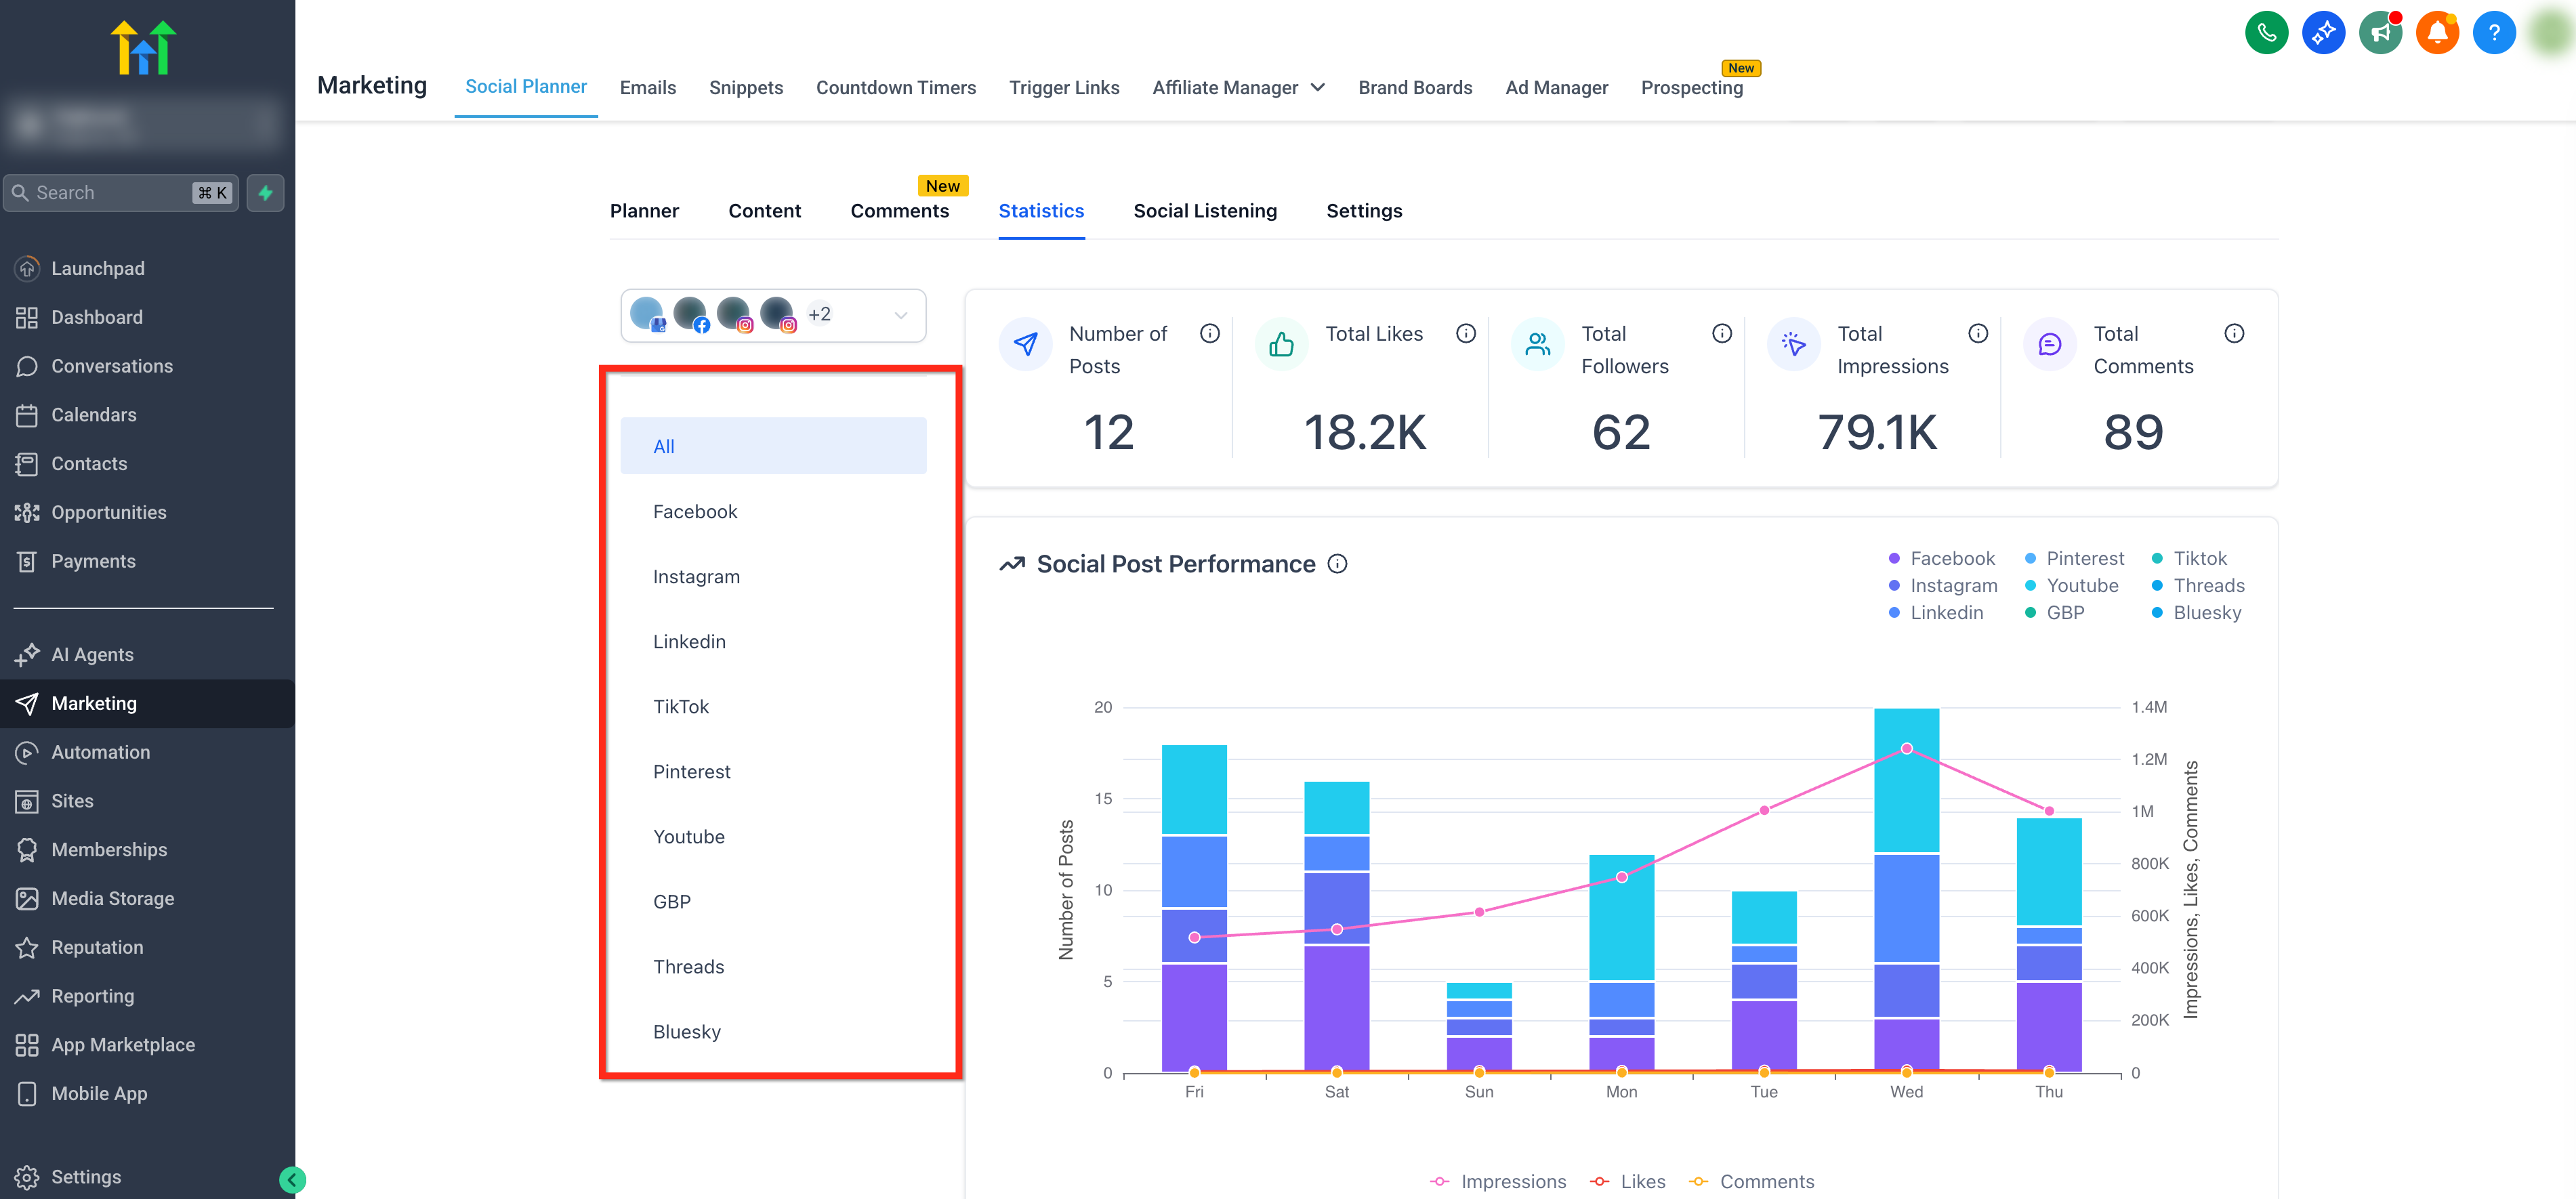
Filtering by Platform and Account
Section titled “Filtering by Platform and Account”To analyze specific data streams, open the account dropdown in the upper-left and check the boxes for the precise accounts you want included in the metrics.
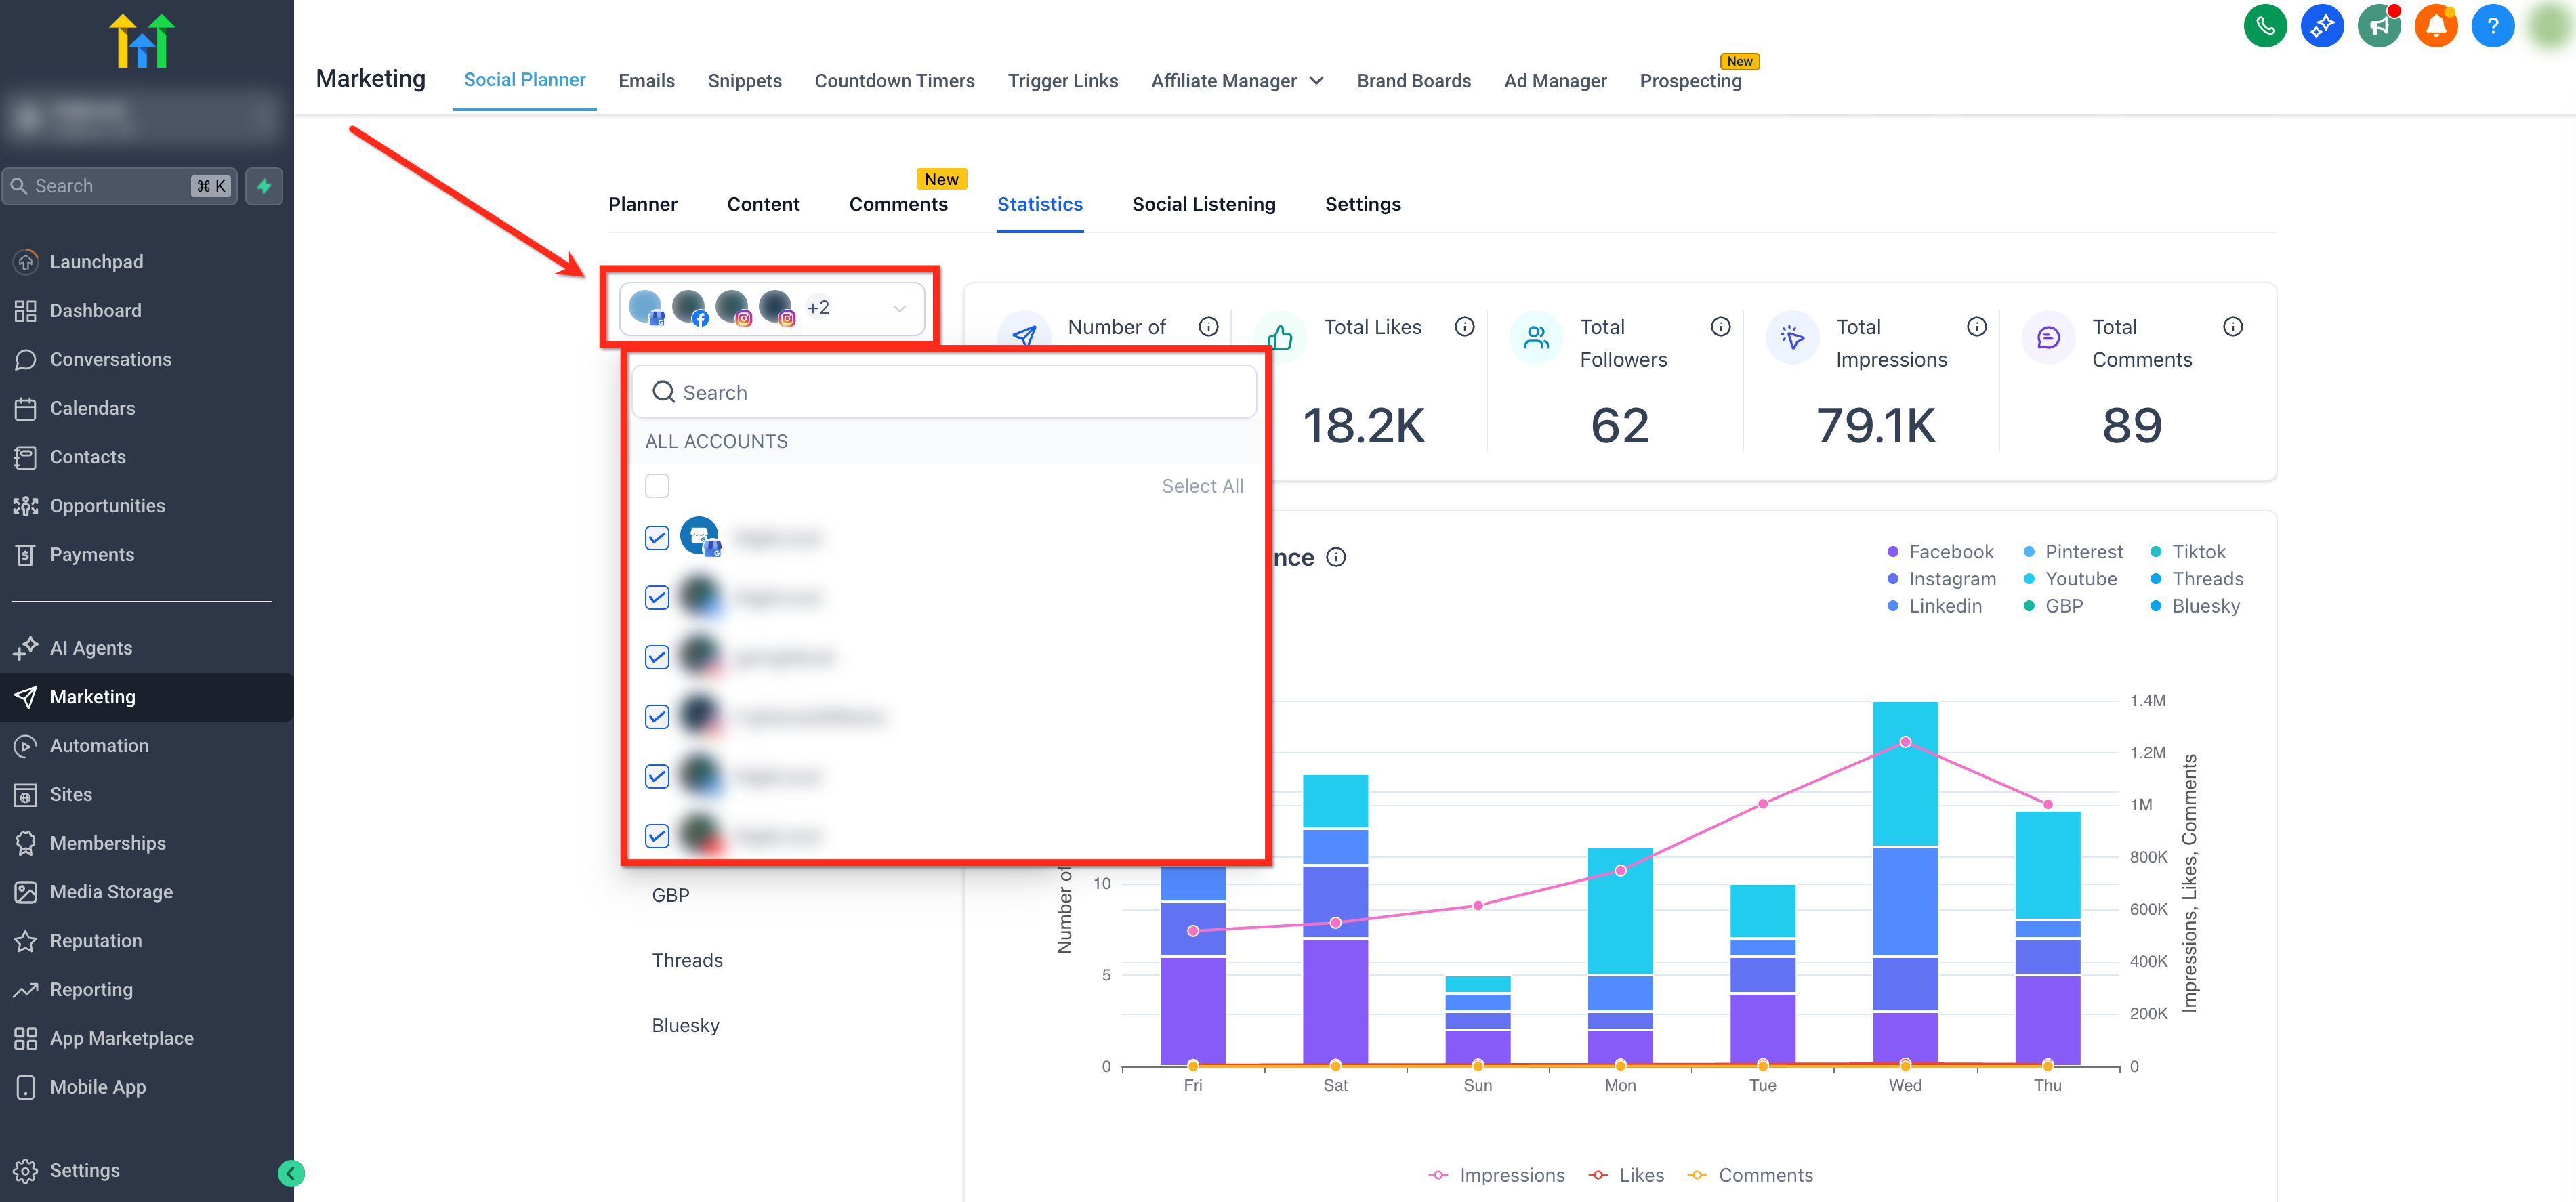
Use the horizontal selector ribbon to filter results based on the social media platform. Choose All for a cross-platform rollup, or select a specific platform (e.g., Threads, Bluesky) to narrow your results.
Available Reports and Metrics
Section titled “Available Reports and Metrics”[!TIP] Hover over the tooltip
(i)next to any rendered metric for precise definitions, supported platforms, and localized time-range details.
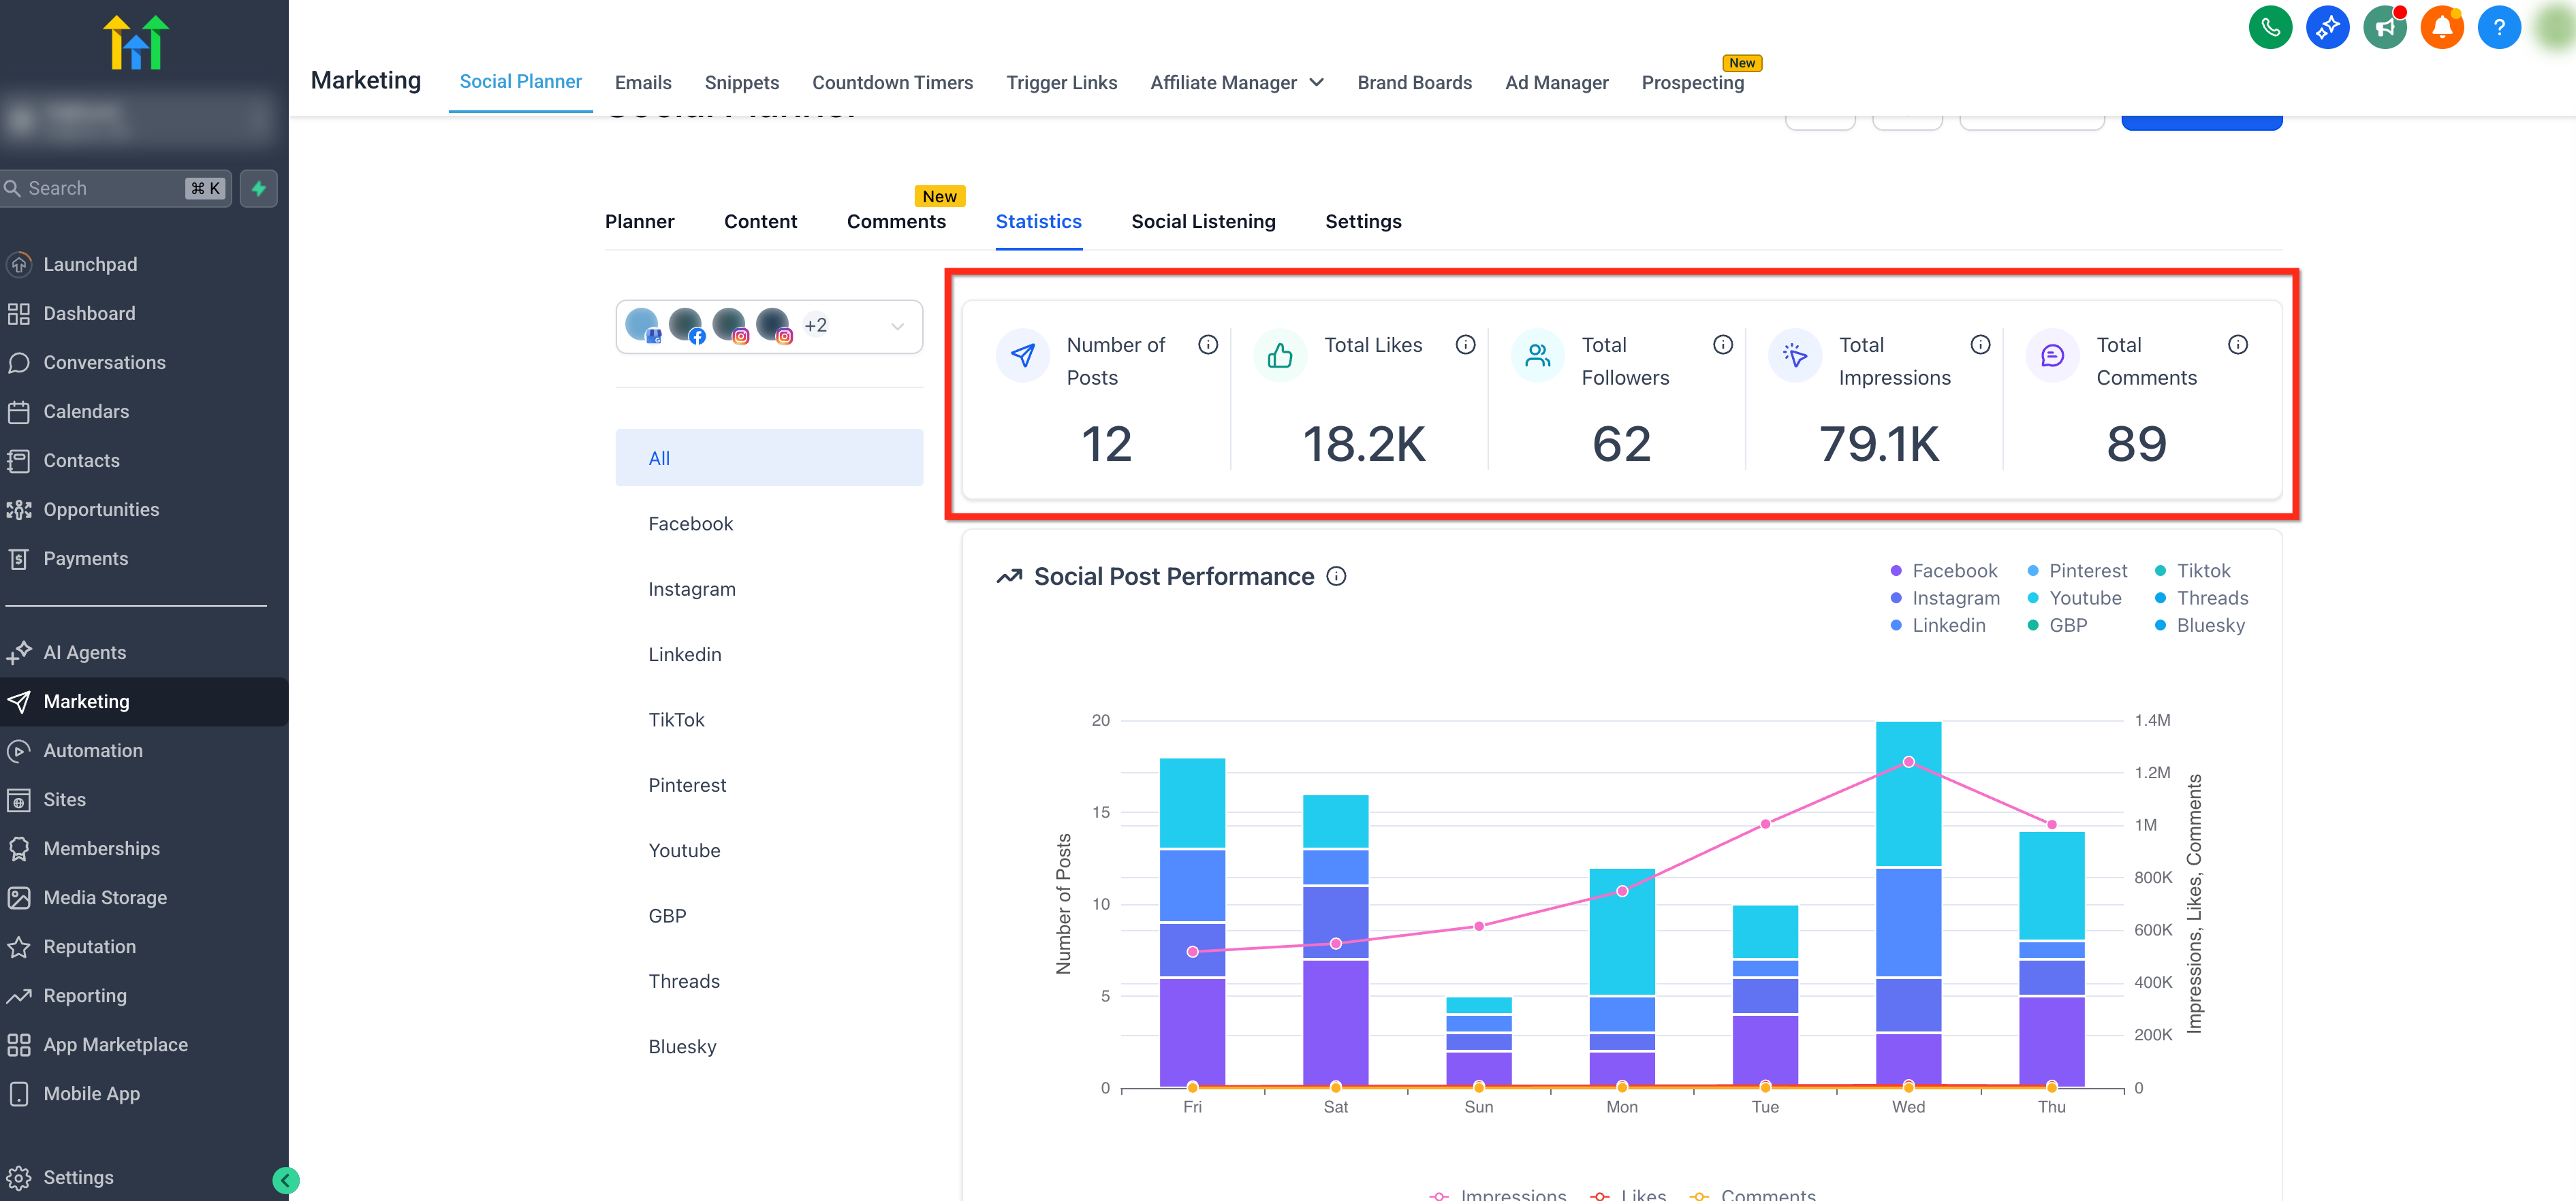
KPI Overview
Section titled “KPI Overview”Track core numbers instantly at a glance.
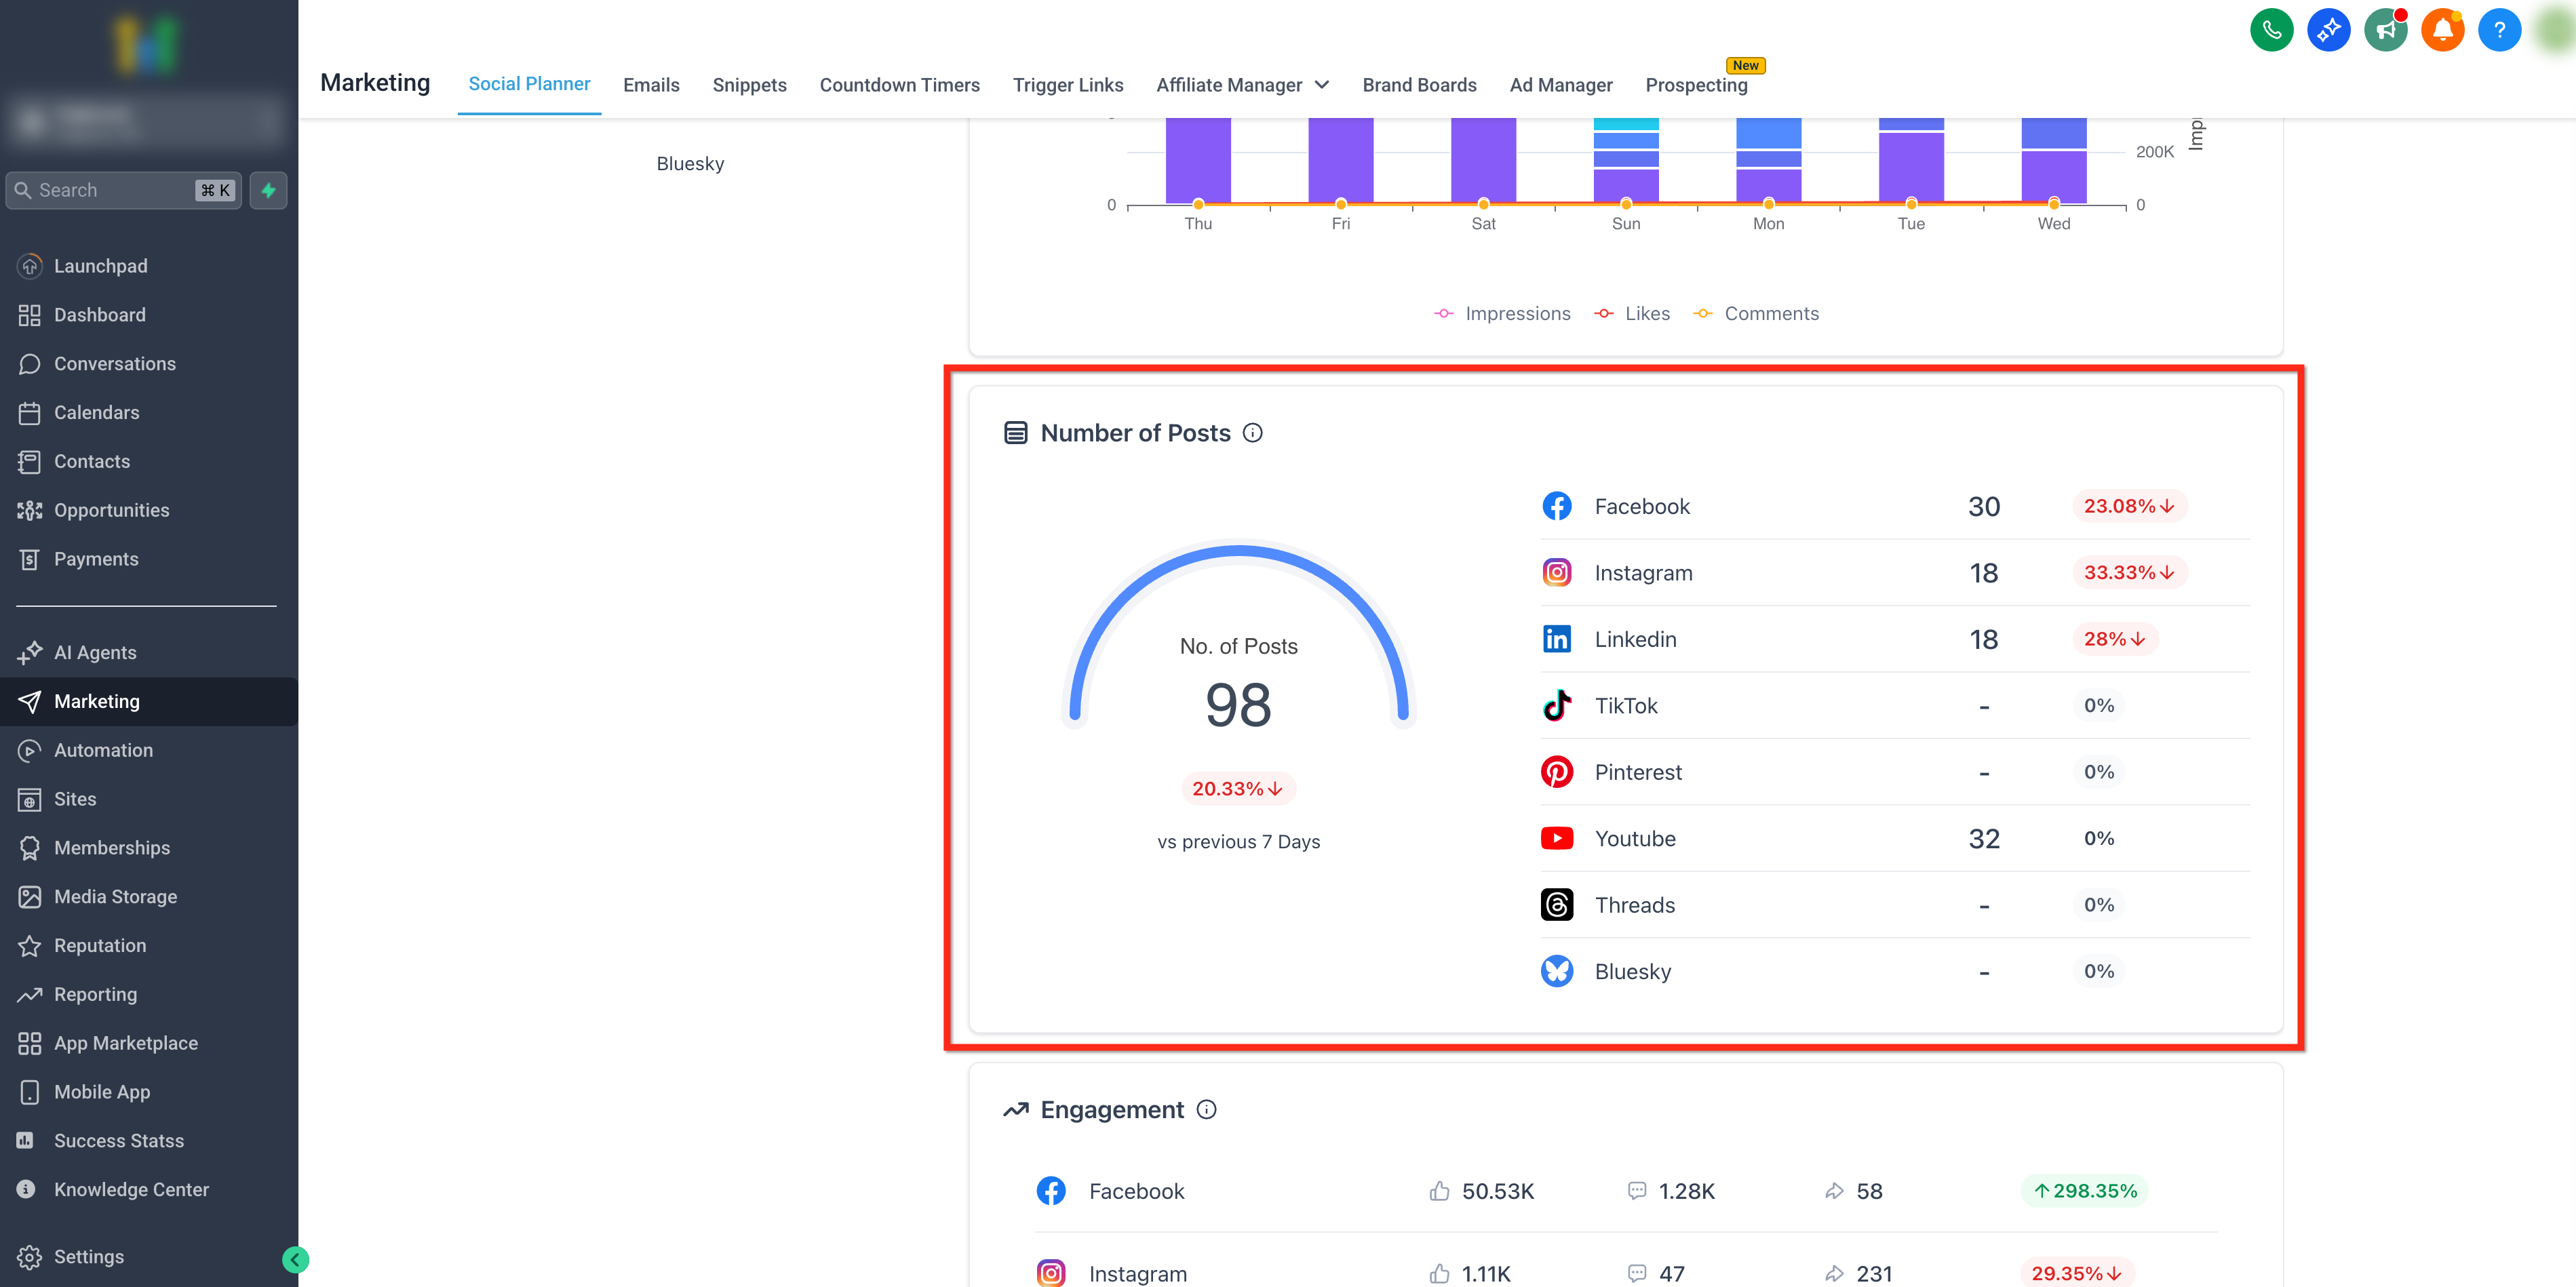
- Number of Posts: Total number of posts published across all selected social accounts.
- Total Likes: Total likes on posts published across all selected accounts.
- Total Followers: Total unique followers who joined across selected social accounts.
- Impressions: Total unique times published posts were displayed.
- Comments: Total count of comments on published posts.
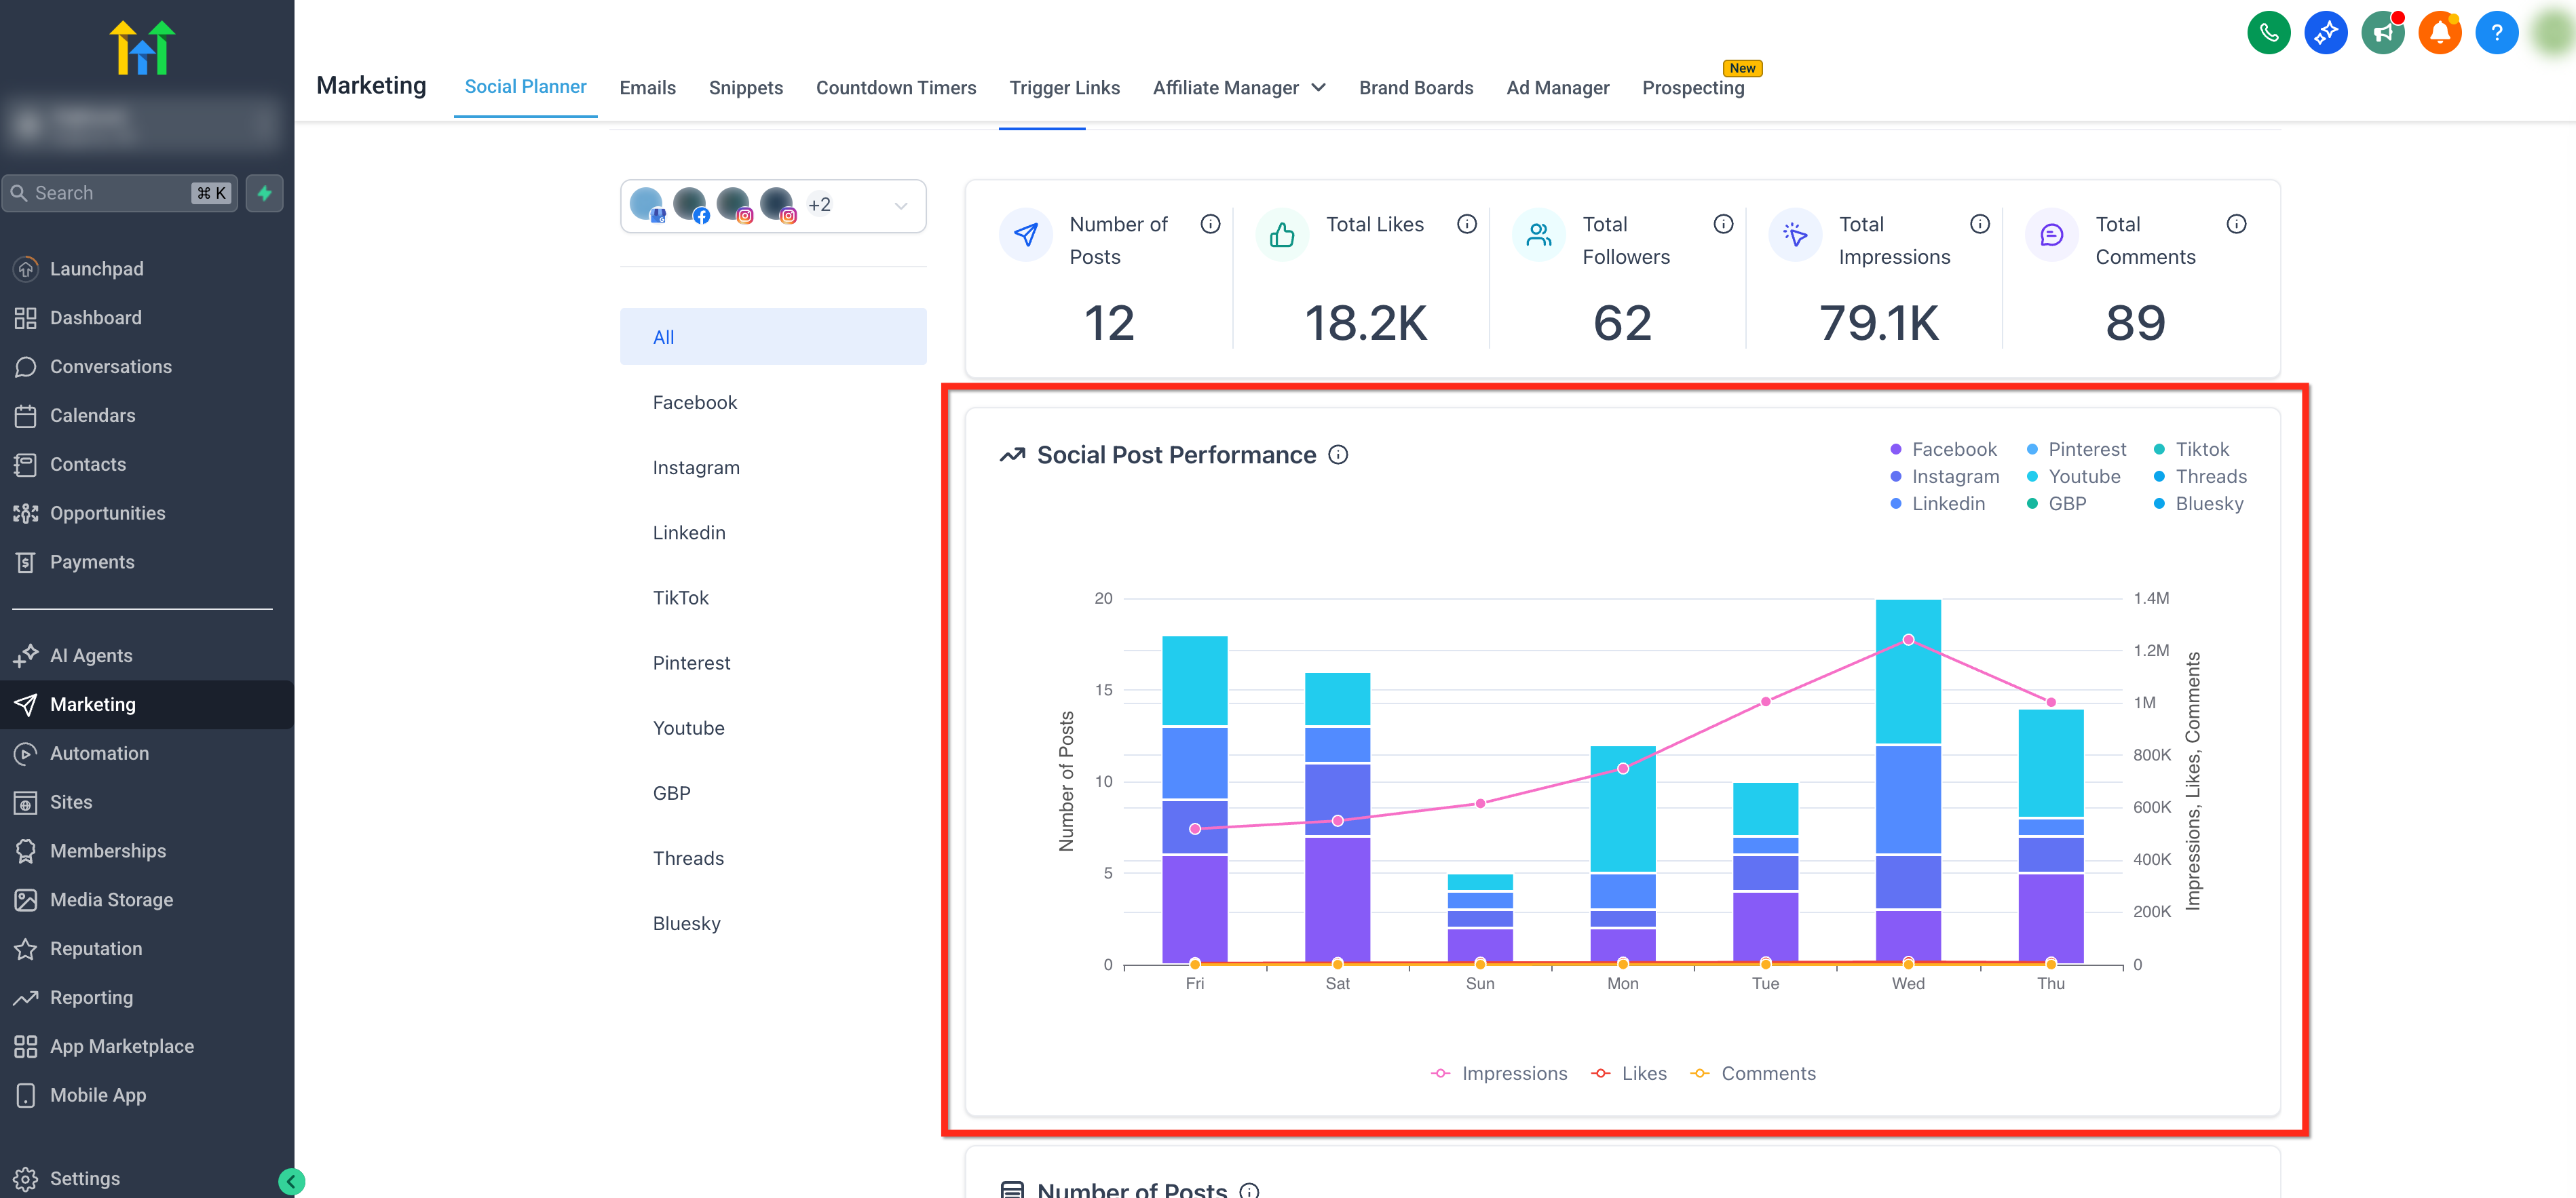
Social Post Performance
Section titled “Social Post Performance”Visualize your Social Post Performance with an interactive graph, showcasing published posts (bars) alongside daily totals for impressions, likes, and comments (lines) so you can track posting trends and weekly performance at a glance.
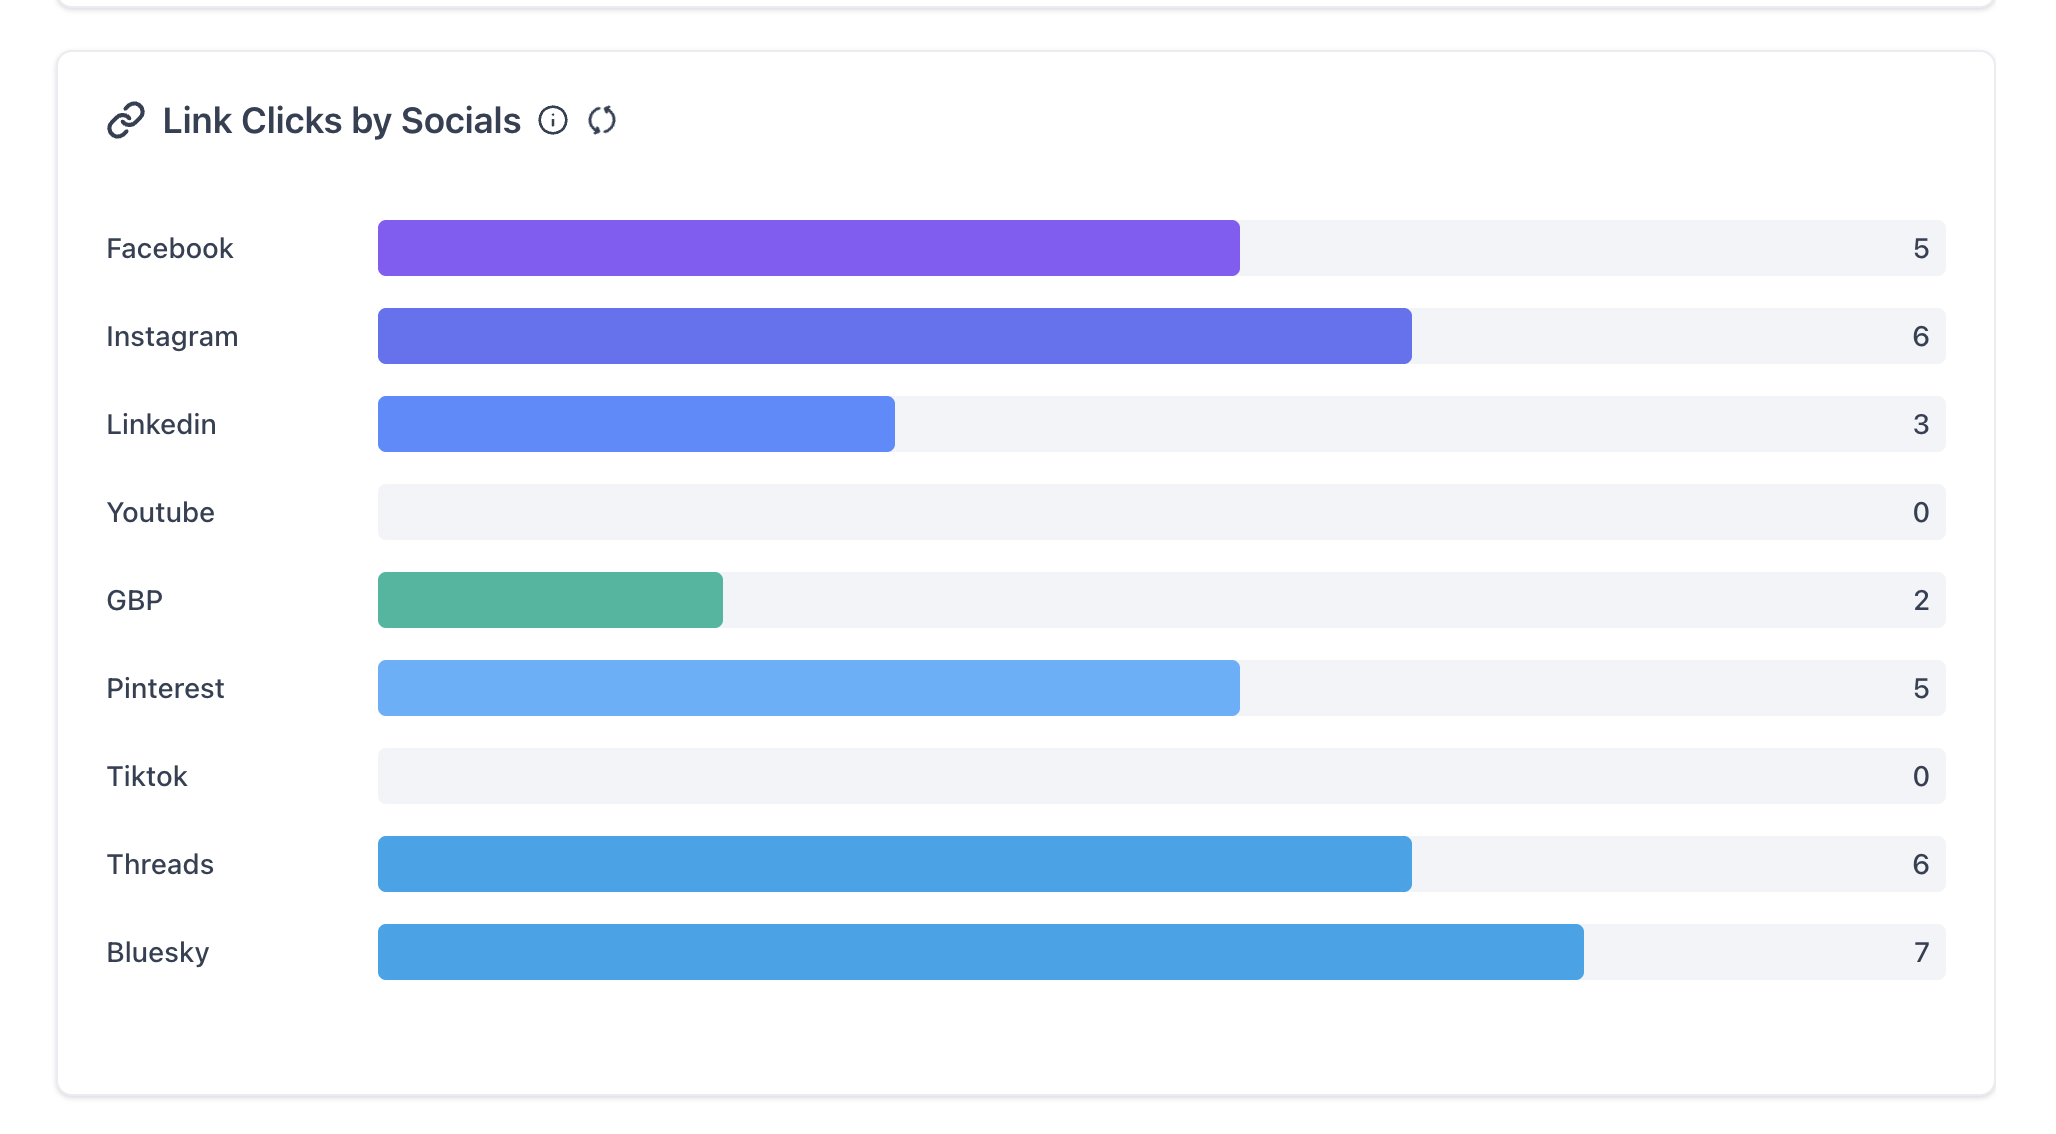
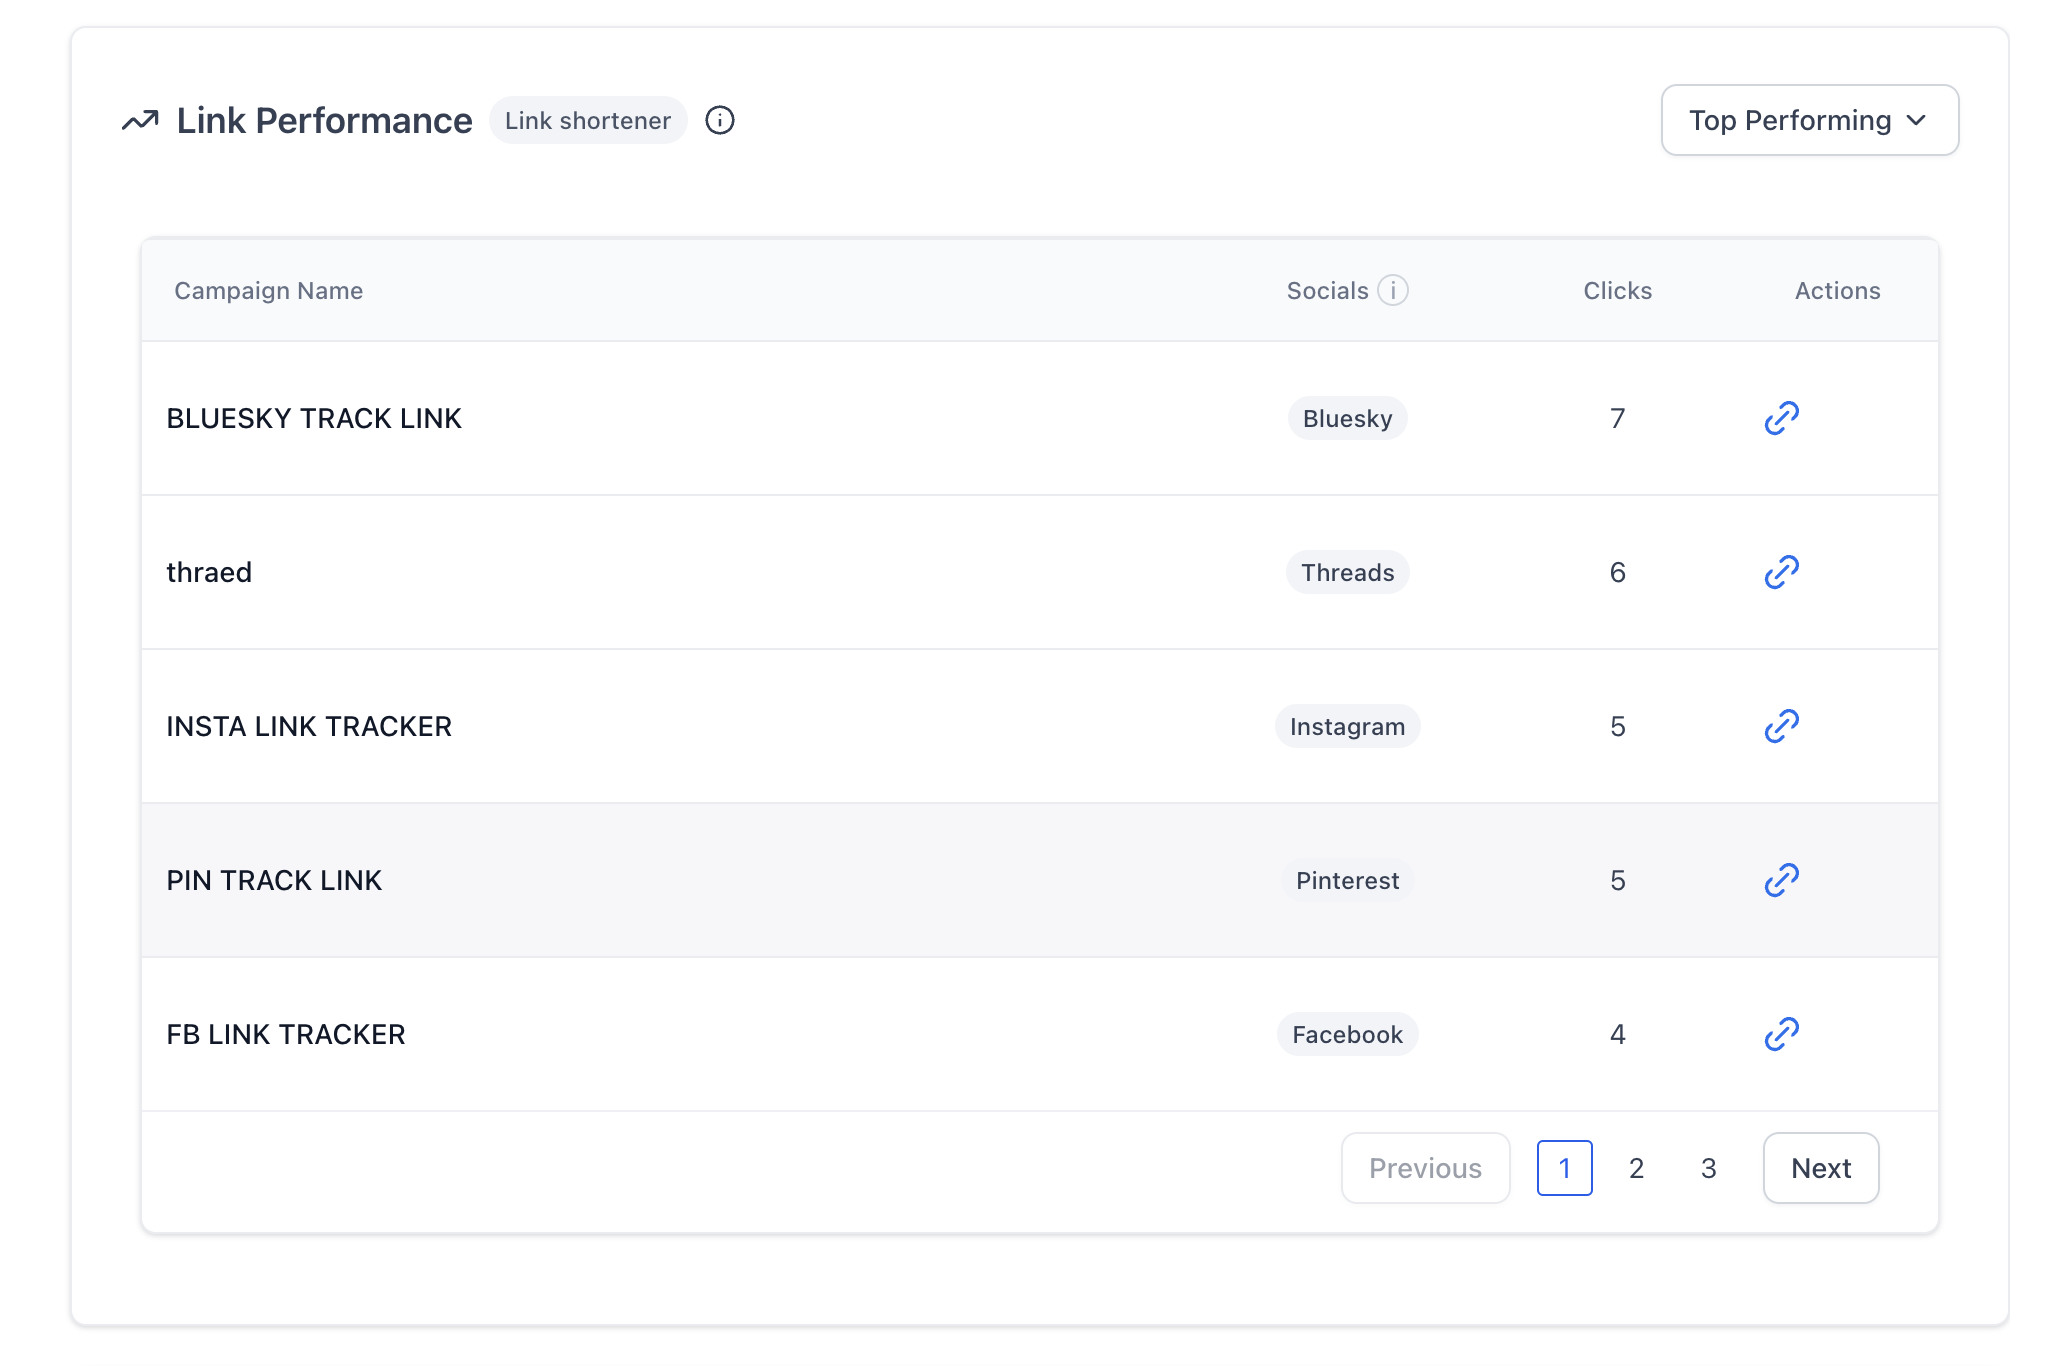
Link Clicks by Socials & Link Performance
Section titled “Link Clicks by Socials & Link Performance”Track the performance of your shortened links across all platforms, including total clicks per link belonging to a campaign.
[!CAUTION] Tracking is actively available only for shortened links created originally through the Social Planner’s internal link shortener.
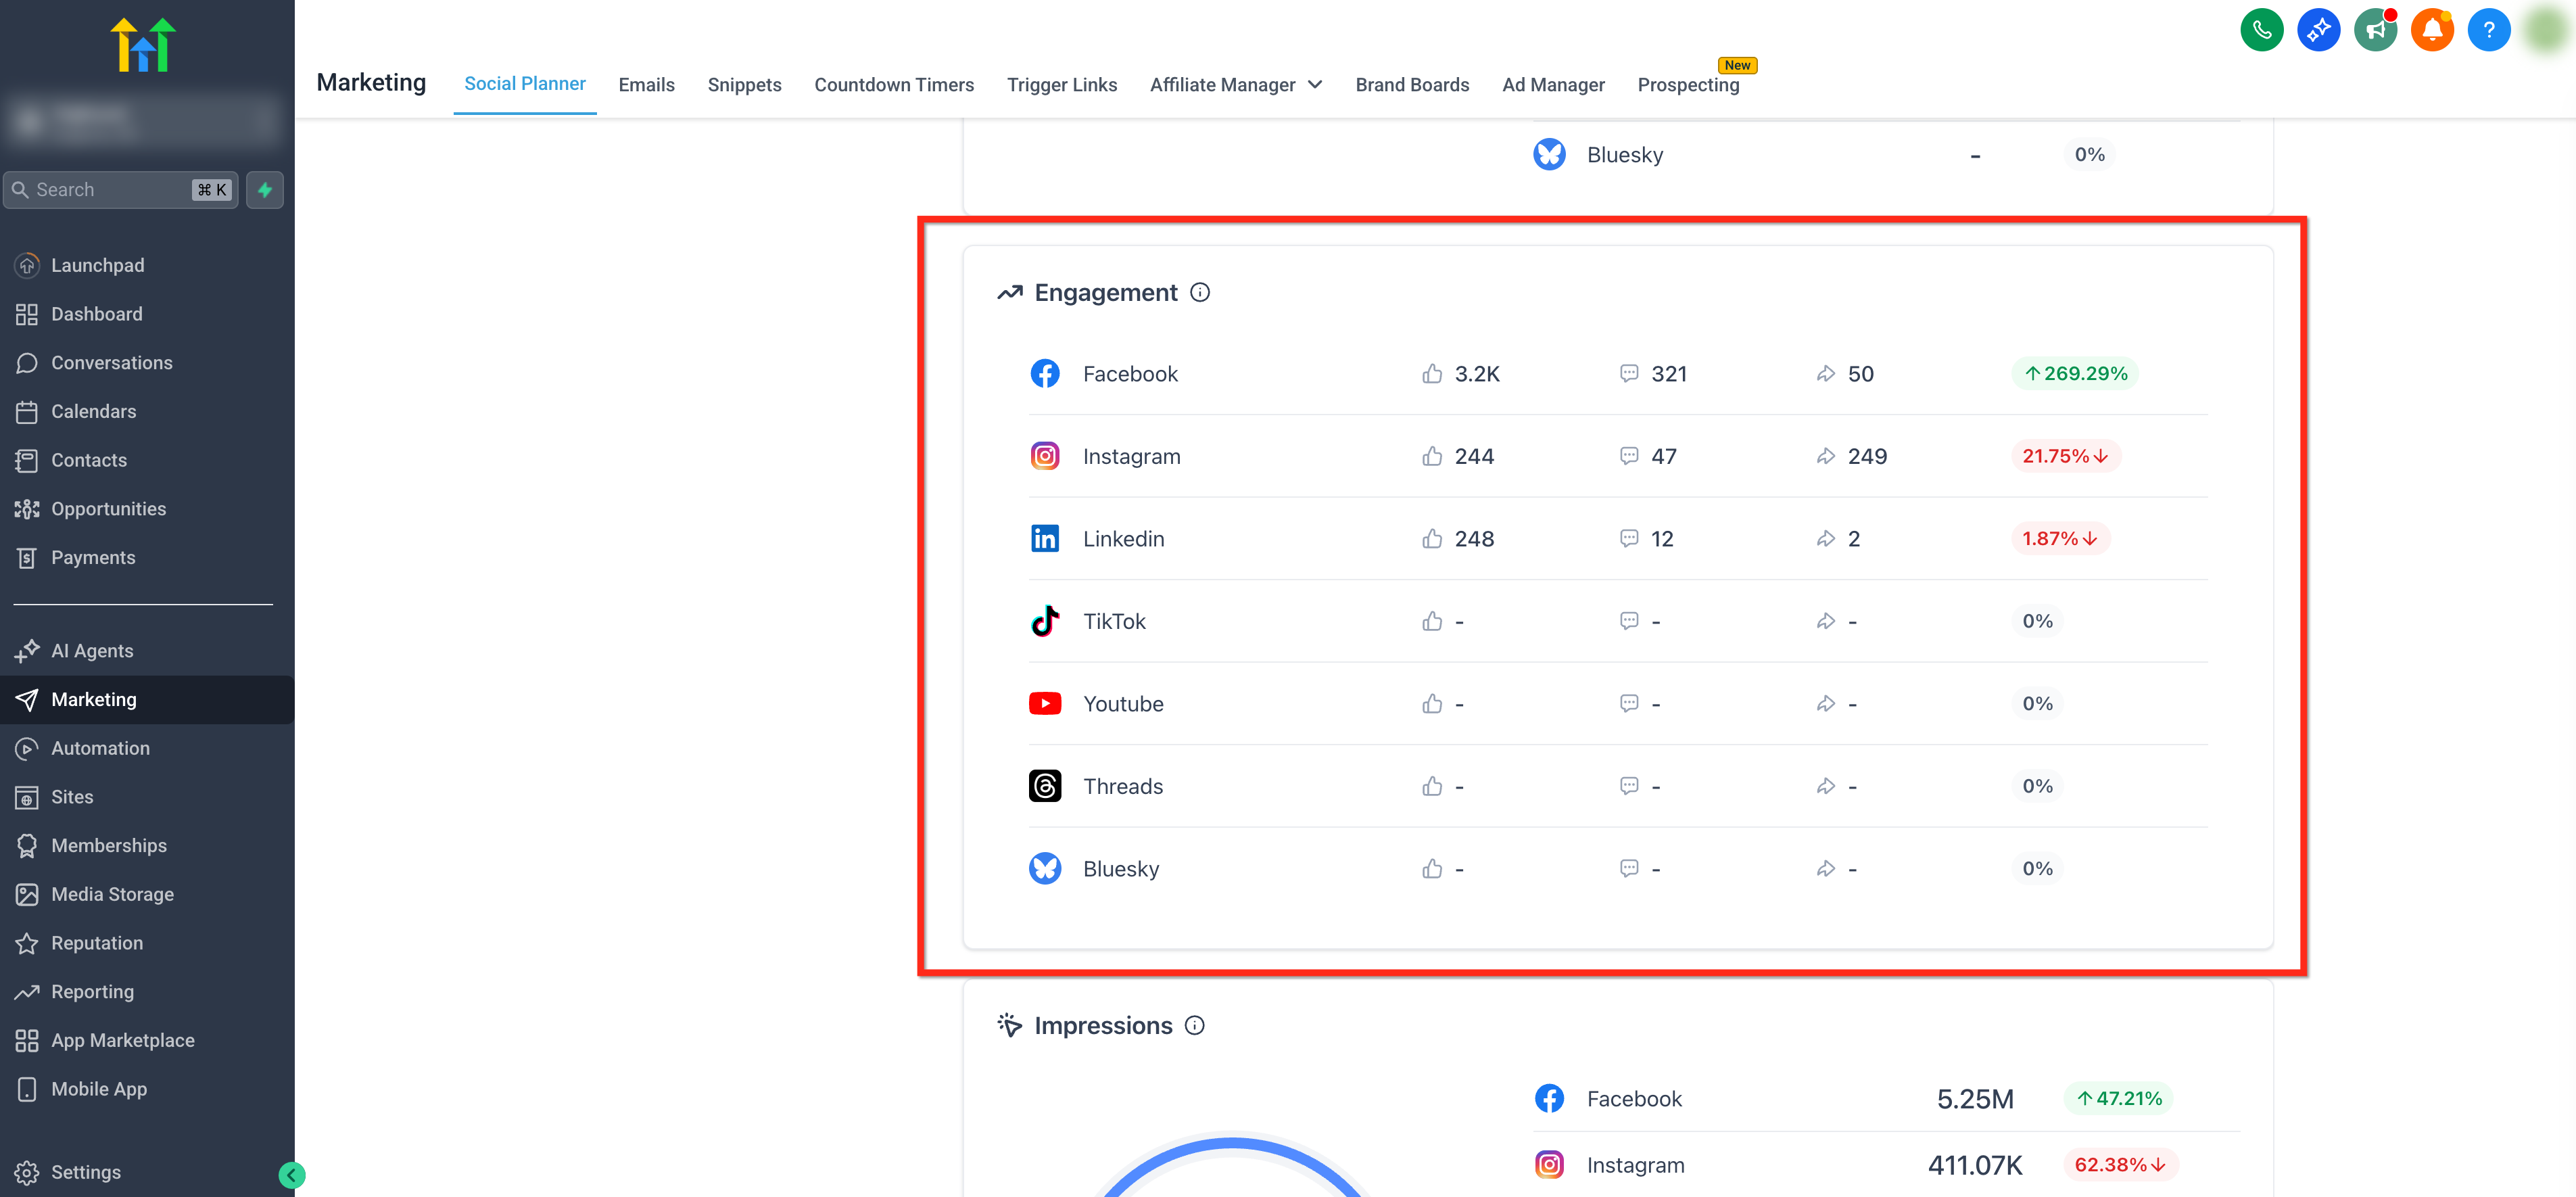
Engagement Breakdown
Section titled “Engagement Breakdown”Displays the unique number of likes, comments, and shares received, broken down by individual platform. The engagement percentage reflects the change in this week’s data compared to the previous week.
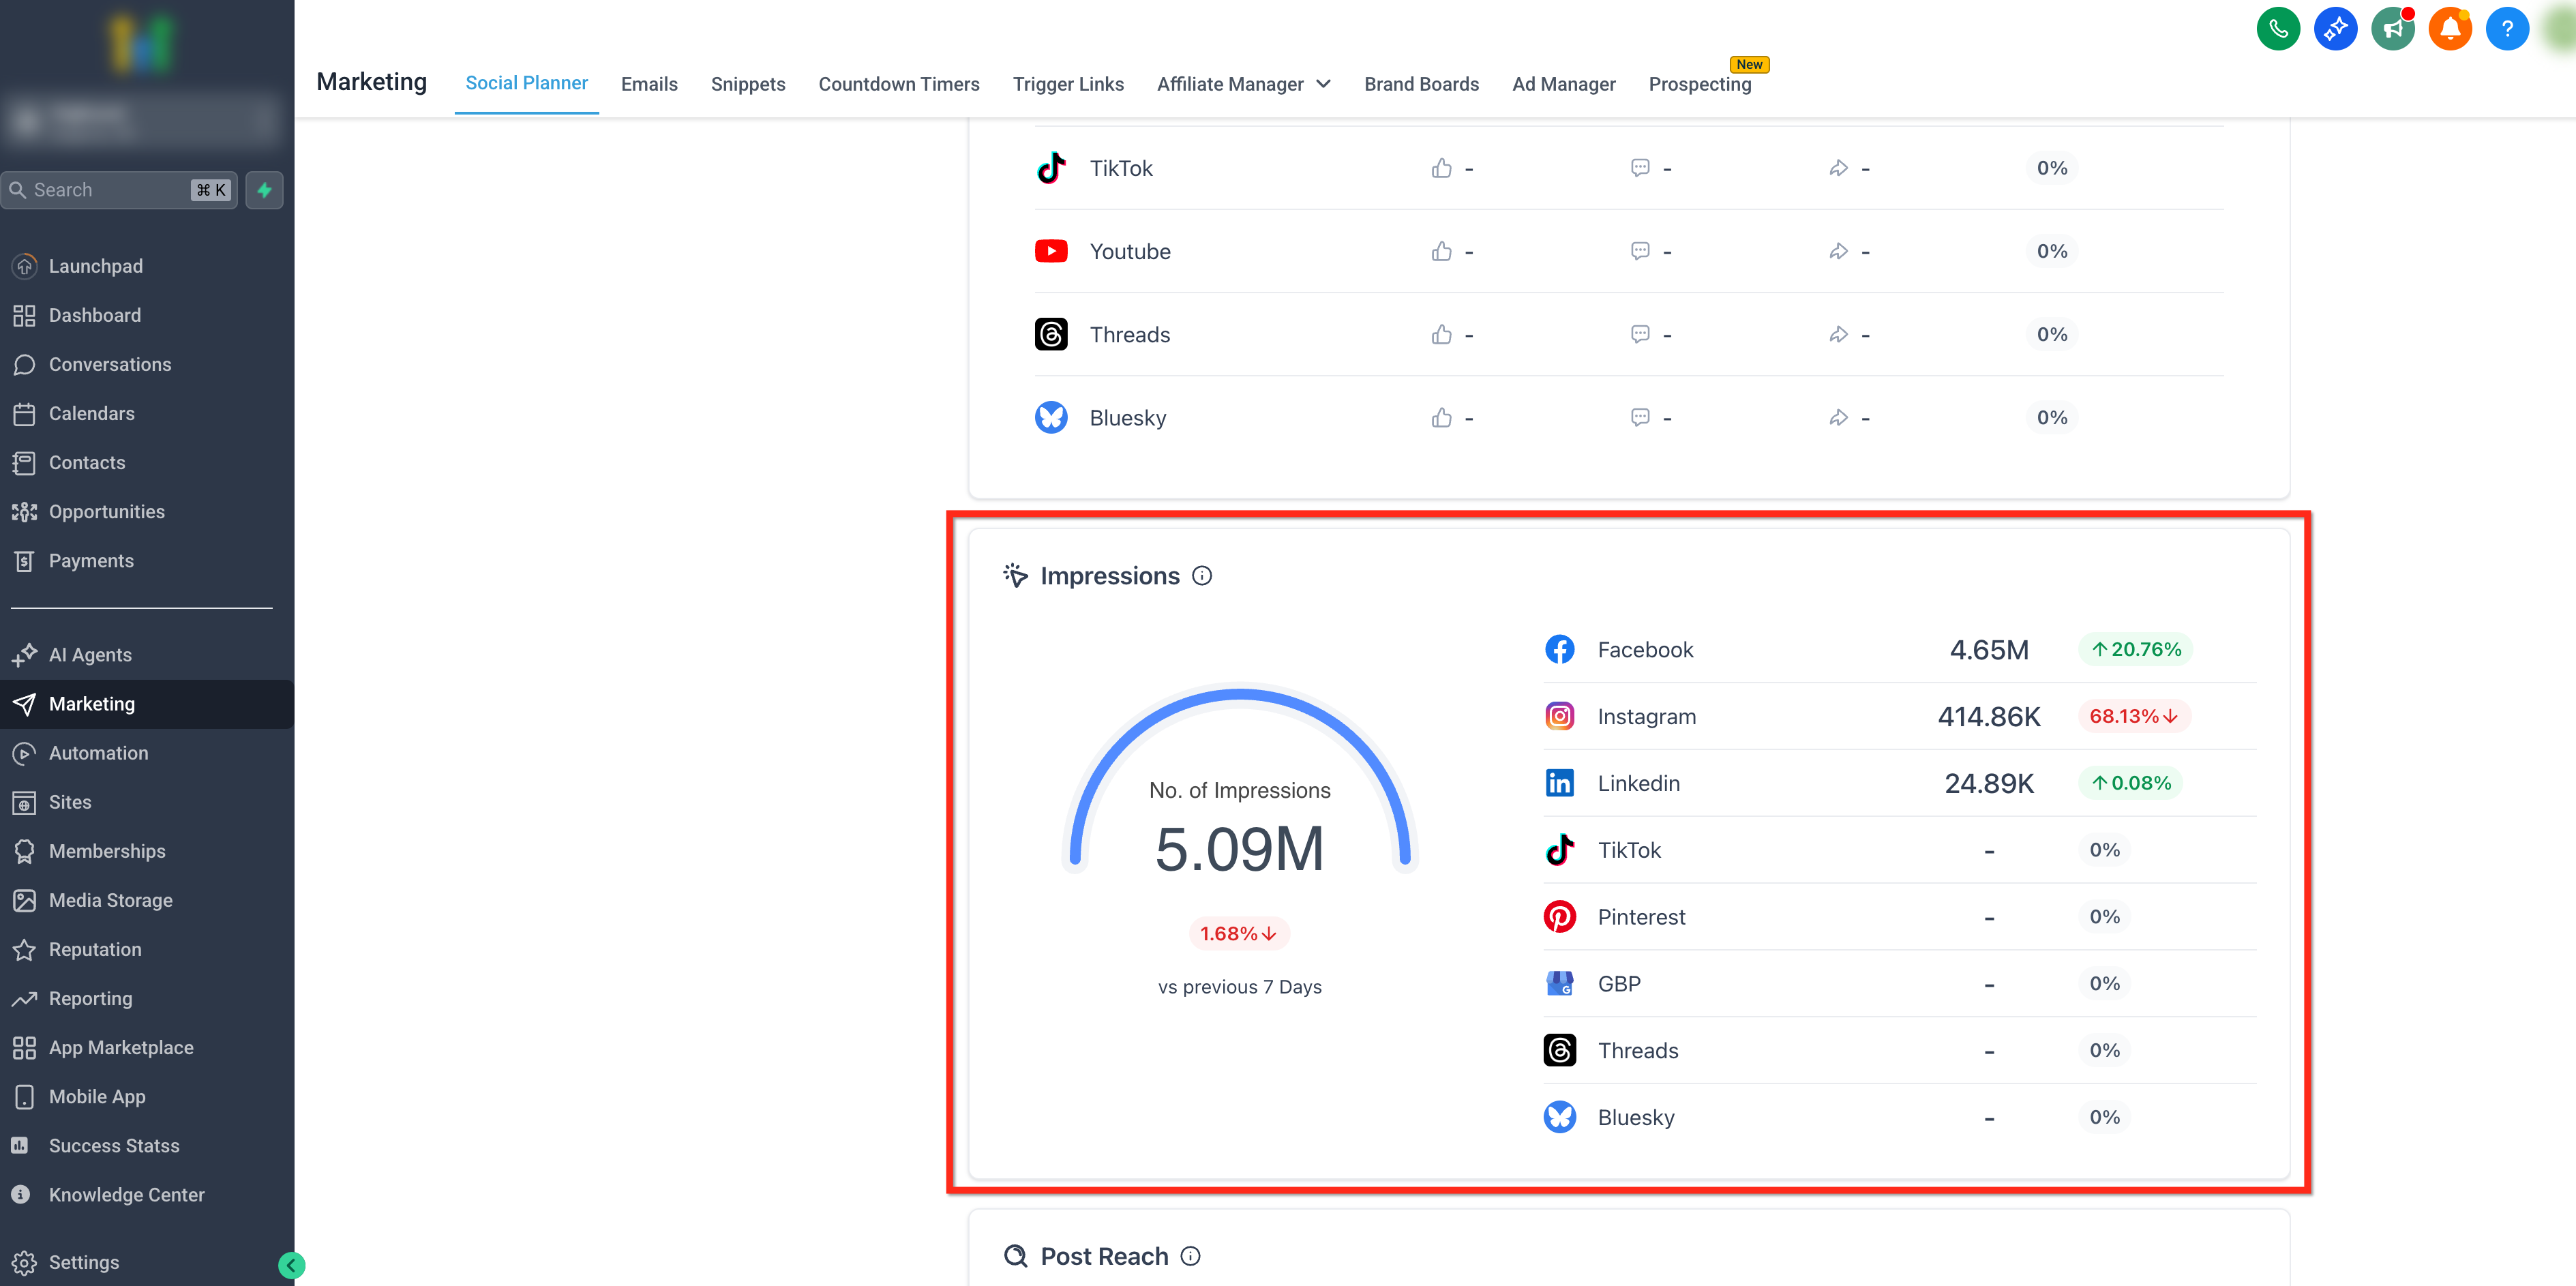
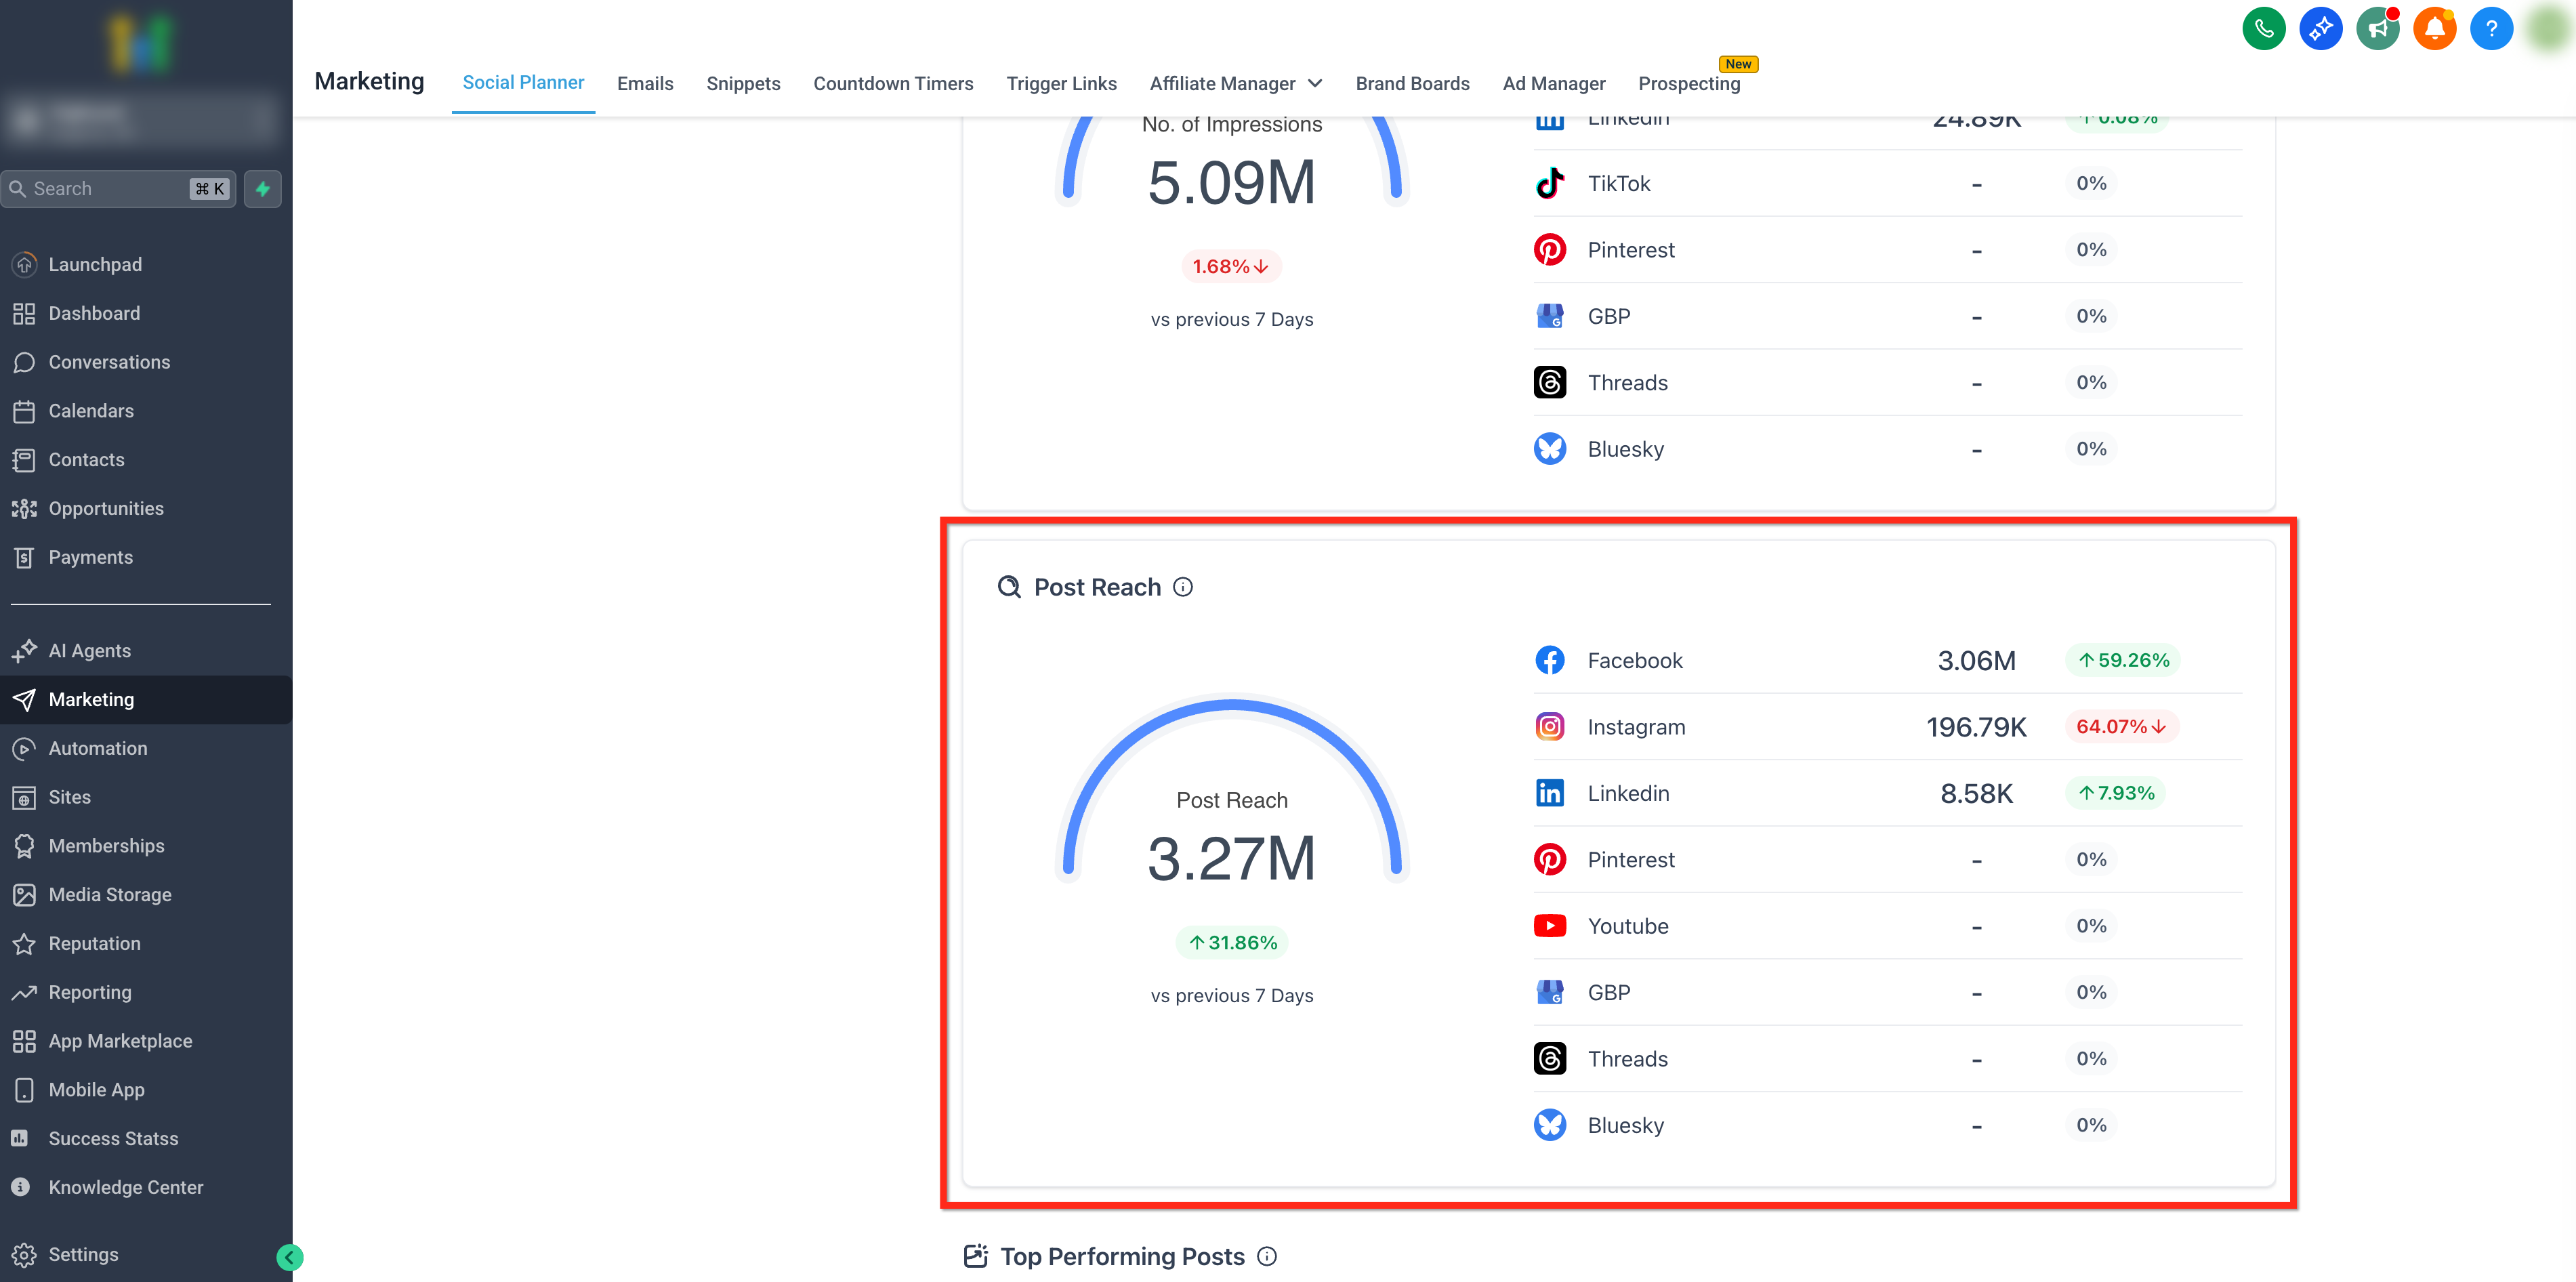
Impressions & Post Reach
Section titled “Impressions & Post Reach”- Impressions: Shows the number of times any published post was displayed on a person’s screen.
- Post Reach: Helps you understand the number of unique people who have seen content from your page. For Google Business Profile, this reach actively reflects Call Clicks, Website Clicks, Bookings, Menu Clicks, and Direction Requests.
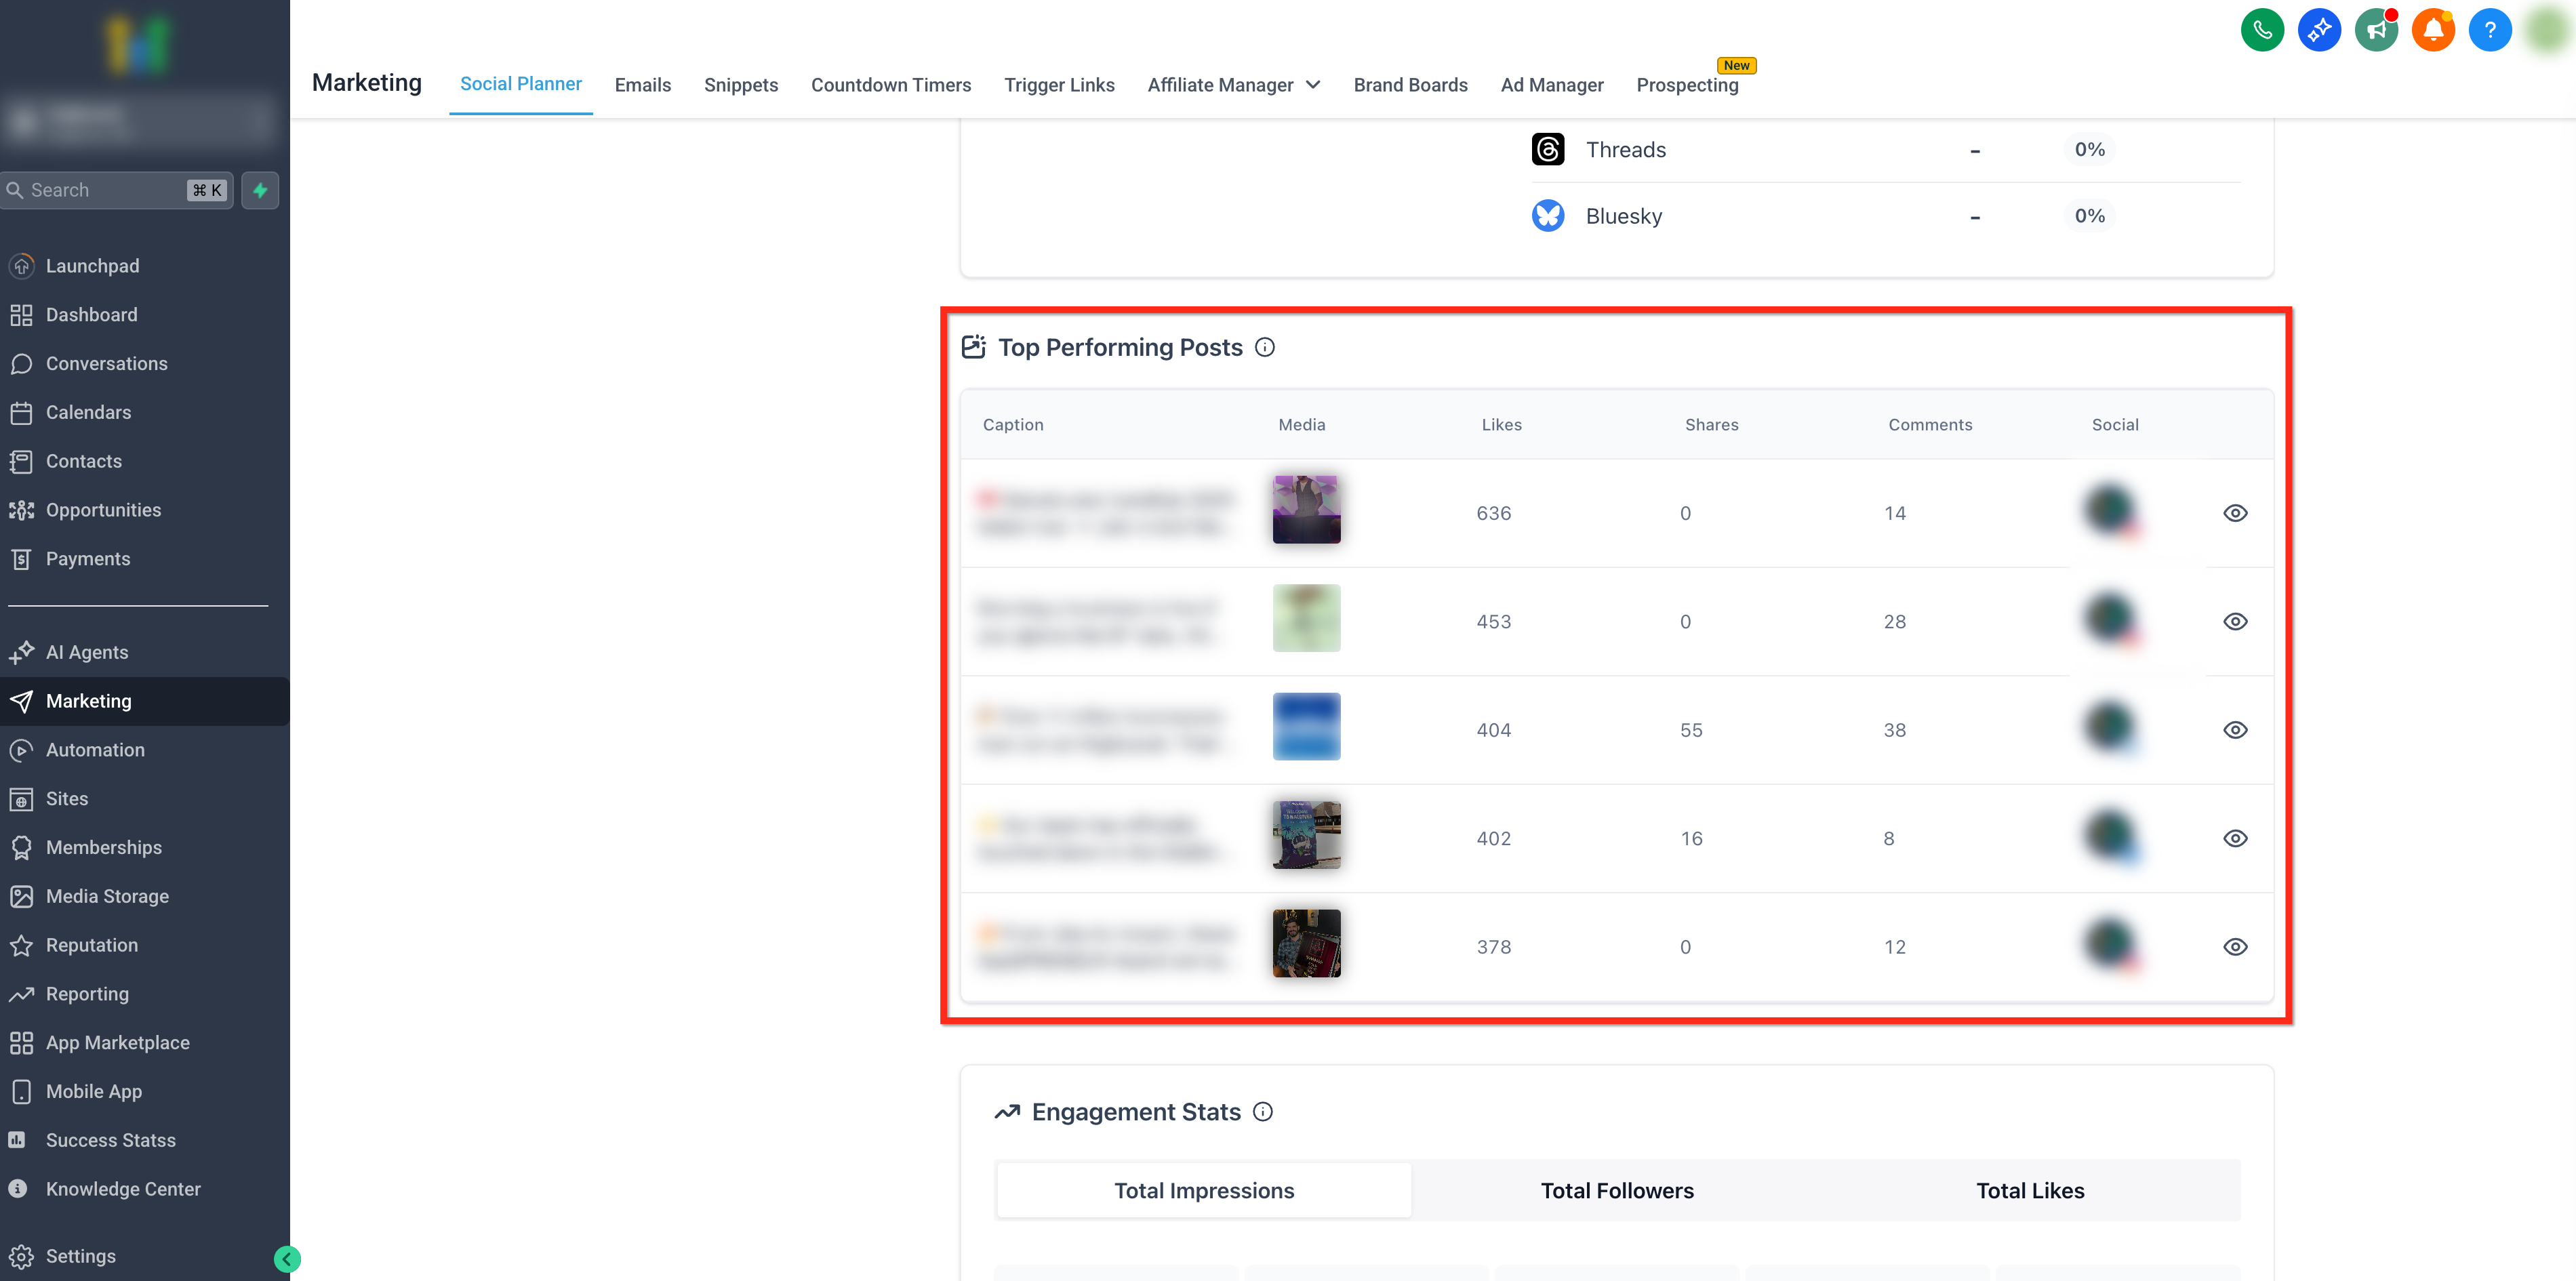
Top Performing Posts
Section titled “Top Performing Posts”Use this report to surface your top all-time posts. Top-performing posts are ranked by the highest number of likes among content published from the planner. Click the Eye icon next to any post to view that individual post within its native interface.
Engagement Stats Tab
Section titled “Engagement Stats Tab”Get a detailed view of engagement metrics categorized per platform. Use the selector ribbon to switch between Total Engagement, Total Followers, and Total Likes.
Gender and Age Demography
Section titled “Gender and Age Demography”Dive into detailed demographic mapping, including the gender distribution (male, female, and unknown) and age range insights.
[!NOTE] Demographic data is only available for viewers who have actively shared their data with the respective Social Media Platforms. On Instagram, this metric is exclusively available for accounts with 100 or more followers.
Supported Platforms and Limitations
Section titled “Supported Platforms and Limitations”Metric availability natively varies on each network based on API constraints.
Permissions and Reauthentication Alerts
Section titled “Permissions and Reauthentication Alerts”Receive real-time dashboard alerts when connected accounts require re-authentication to continue accessing analytics. Users will be able to see their updated statistics the day after upgrading permissions.
Metric Availability Table
Section titled “Metric Availability Table”| Metric | YouTube | TikTok | GBP | Threads | Bluesky | ||||
|---|---|---|---|---|---|---|---|---|---|
| No. of Posts | ✅ | ✅ | ✅ | ✅ | ✅ | ✅ | ❌ | ✅ | ✅ |
| Likes | ✅ | ✅ | ✅ | ✅ | ❌ | ✅ | ❌ | ✅ | ✅ |
| Comments | ✅ | ✅ | ✅ | ✅ | ❌ | ✅ | ❌ | ✅ | ✅ |
| Followers | ✅ | ✅ | ✅ | ✅ | ❌ | ✅ | ❌ | ✅ | ✅ |
| Impressions | ✅ | ✅ | ✅ | ❌ | ✅ | ✅ | ✅ | ✅ | ❌ |
| Post Reach | ✅ | ✅ | ✅ | ✅ | ❌ | ❌ | ✅ | ❌ | ❌ |
| Engagement | ✅ | ✅ | ✅ | ✅ | ❌ | ✅ | ❌ | ✅ | ✅ |
| Top Posts | ✅ | ✅ | ✅ | ✅ | ✅ | ✅ | ❌ | ❌ | ❌ |
| Demography | ❌ | ✅* | ❌ | ❌ | ❌ | ❌ | ❌ | ❌ | ❌ |
*Instagram demographic data requires ≥ 100 followers.
Platform-Specific API Delays & Needs
Section titled “Platform-Specific API Delays & Needs”- TikTok: Only Business profiles are supported. Metrics may take 1 to 2 days to reflect due to native API availability delays.
- Pinterest: Takes 2 days (n-2) to reflect correct graphical data due to API constraints.
- LinkedIn: Only professional LinkedIn Pages are supported (personal profiles are excluded due to API limitations). Follower counts operate on an n-2 day delay.
- Threads: Operates on a T-1 day delay. Impressions, post reach, and detailed demographics are unsupported.
- Bluesky: Operates on a T-1 day delay. Follower metrics and demographics are unsupported.
Frequently Asked Questions
Section titled “Frequently Asked Questions”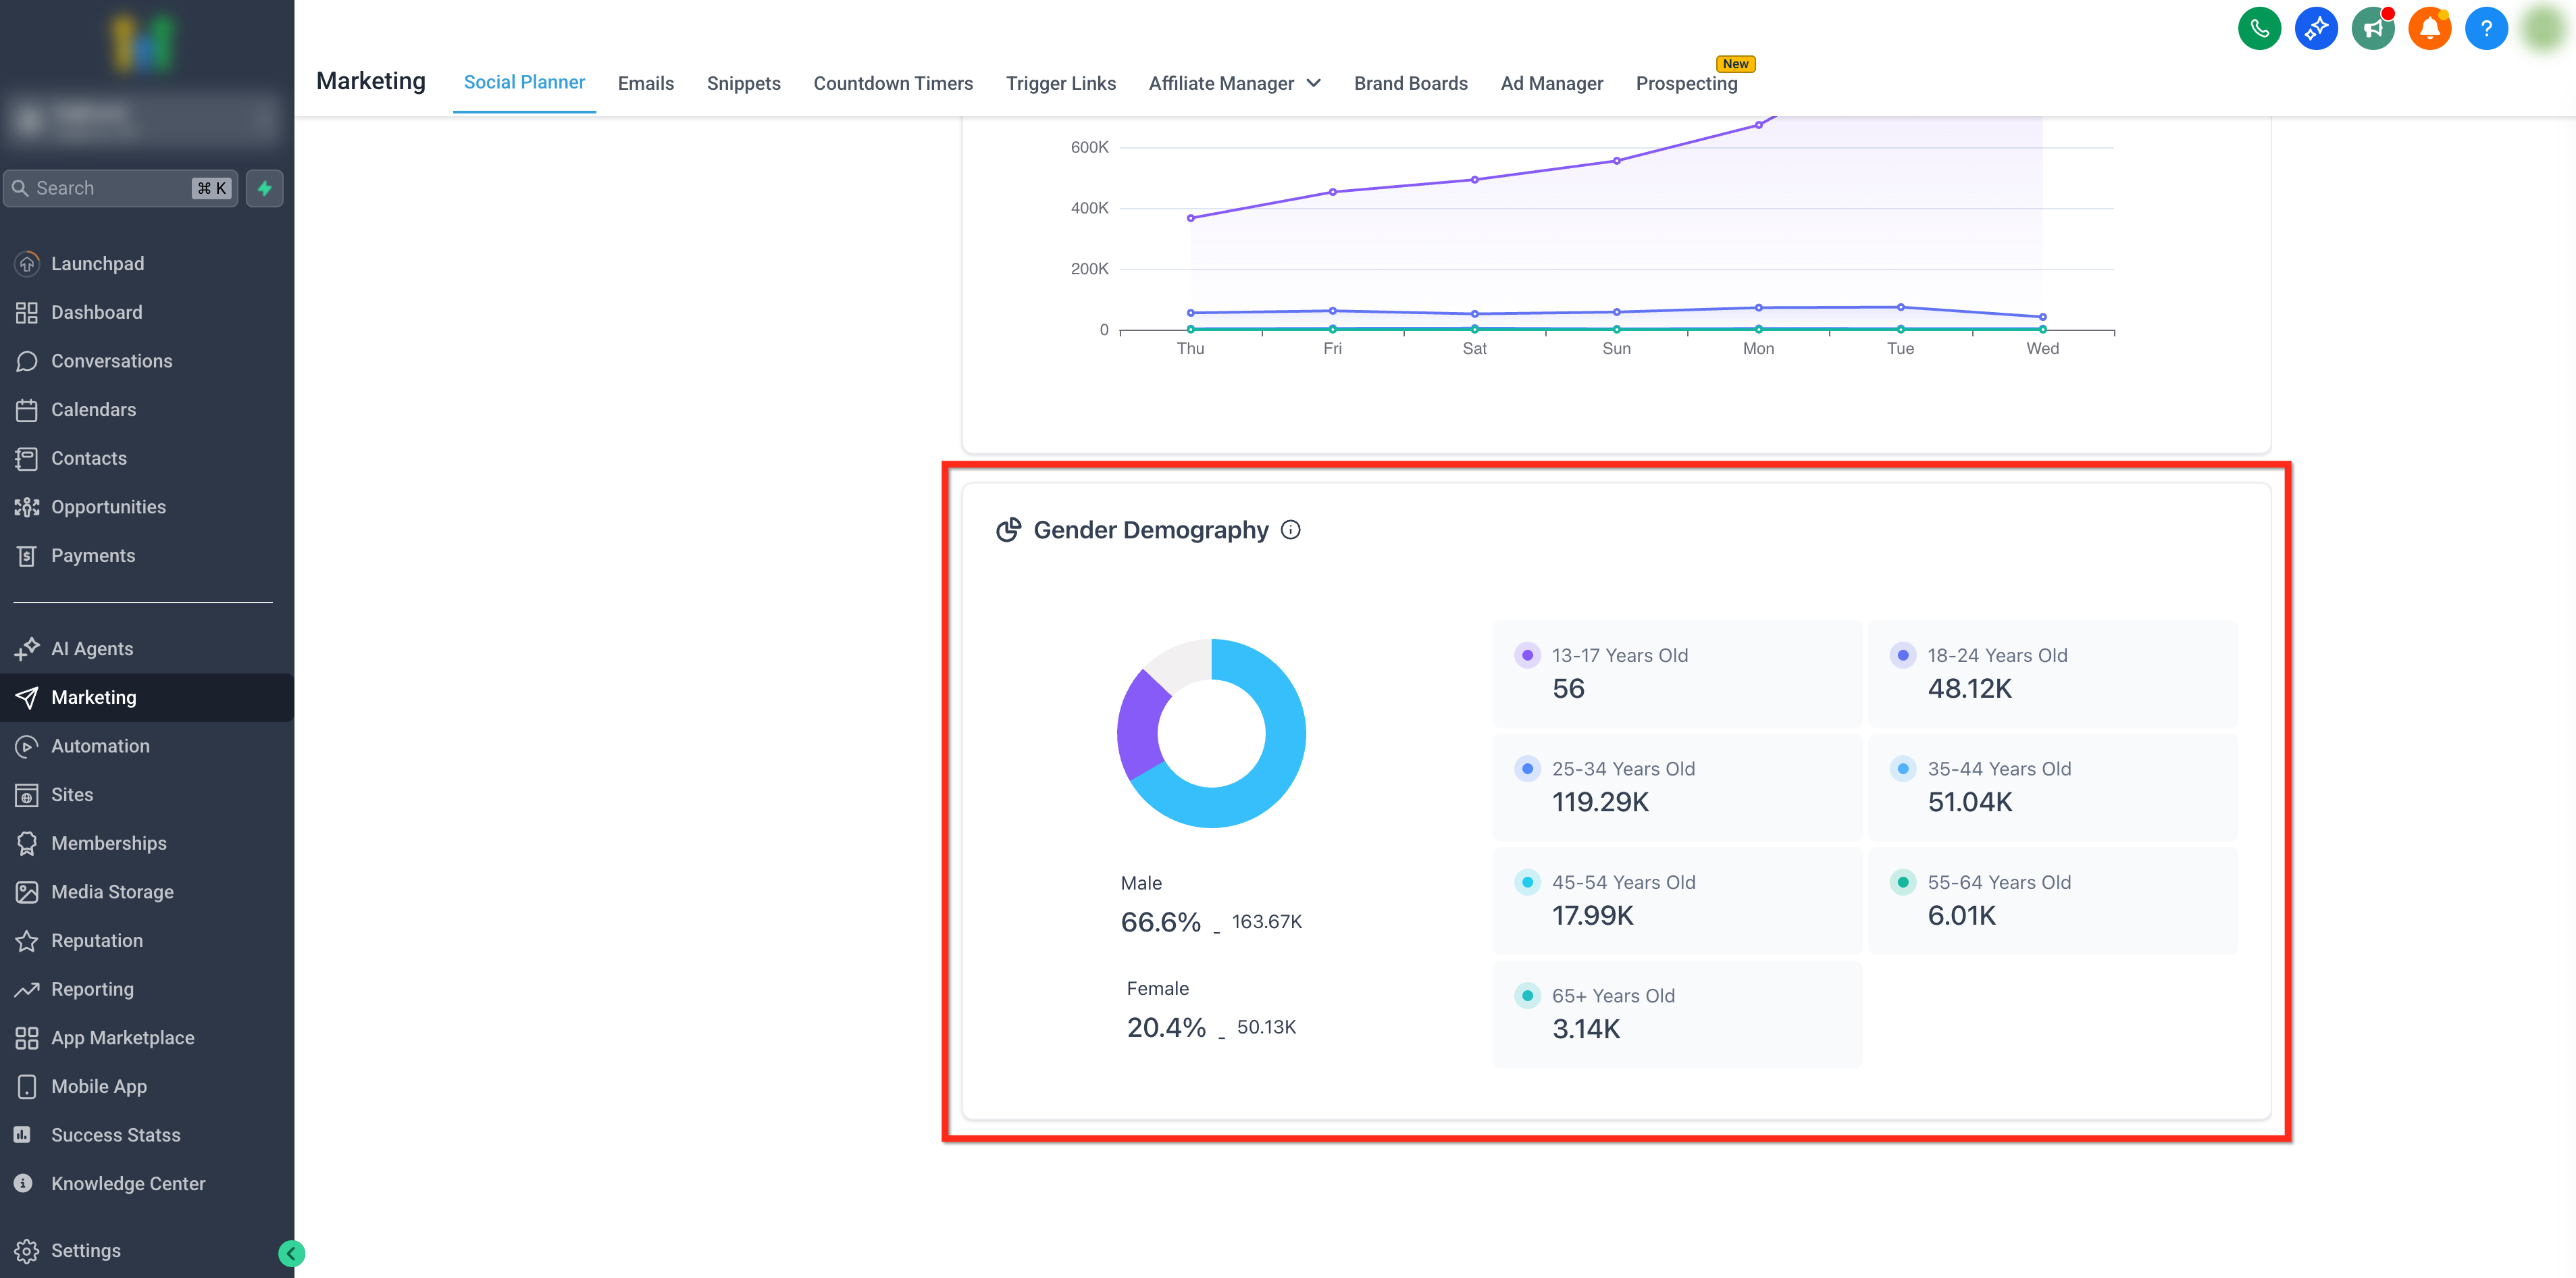
Q: What types of metrics can I track?
You can track core indicators including engagement rates, post reach, impressions, clicks, and general post performance.
Q: Can I compare the performance of different individual posts?
Yes, the Top Performing Posts dashboard allows you to compare the historical performance of specific posts.
Q: Can I export the analytics data for reporting purposes?
No. We currently do not provide an immediate option to export raw analytics as CSV/PDF, though we plan to support robust reporting exports in upcoming quarters.
Q: How often is the data updated?
Unless limited by platform-specific API delays (like TikTok, Pinterest, or Threads), data typically updates in real-time.
Q: What time range can I view?
Core overarching analytics data currently filters on a weekly basis format.